Publisher growth tactics for election season | WEBINAR


Google Analytics is one of the most widely-used website analytics solutions used by publishers. It provides key insights into your website or app traffic and performance, allowing you to make data-driven decisions that can grow your business. Some of the metrics Google Analytics tracks include the number of site visits, bounce rate, time on site, source of traffic, nature of engagement with the website’s content, etc.
The web analytics service is also capable of integrating with other Google solutions such as Google ads and Google Search Console, allowing publishers to get analytic insights across multiple Google tools.
Google launched Google Analytics (GA) in 2005. In 2012, it launched a newer version of GA called Universal Analytics, which is also the version presently in use for most users. Any user who set up their GA account before October 2020 is most likely using Universal Analytics.
GA4 is the latest version of Google Analytics which is set to replace Universal Analytics starting July 1, 2023.
GA4 is capable of tracking data from both websites and apps to provide publishers with richer insights into customer journeys. GA4 is also more compliant with the privacy-protected browsing of the future that is set to be the norm once Google kills the third-party cookie.
The main difference between Google Analytics 4.0 and Universal Analytics is that Universal Analytics uses a cookie-based tracking model while Google Analytics 4.0 uses an IP address-based tracking model. The cookie-based model is more flexible and allows you to track more interactions with your users; however, it can be compromised if your users have cookies disabled or are using private browsing modes.
GA4 unifies analytics for both websites and apps whereas Universal Analytics was capable of tracking consumer journeys only on websites. This makes GA4 capable of multi-platform functionality, while its ability to operate in a cookieless environment makes it a much more user-friendly tool.
Once Google makes GA4 its default and only analytics property starting July 1st, 2023, it will withdraw support for Universal Analytics. This means users will need to migrate to GA4 well in advance if they want to export their existing historical data to the GA4 platform.
To make sure that they are able to hit the ground running with GA4, users will also need to allow GA4 to build historical data of its own to work with.
Any third-party tools that users have integrated with Universal Analytics will also need to be updated so they become compatible for use with GA4.
Since all this takes time, users should switch to GA4 as soon as possible.
Update to GA4 that can deliver a more holistic view of user engagement with websites and apps. Businesses and webmasters are still in the process of upgrading to this new platform.
If you are considering making the switch, check out the below-mentioned steps.
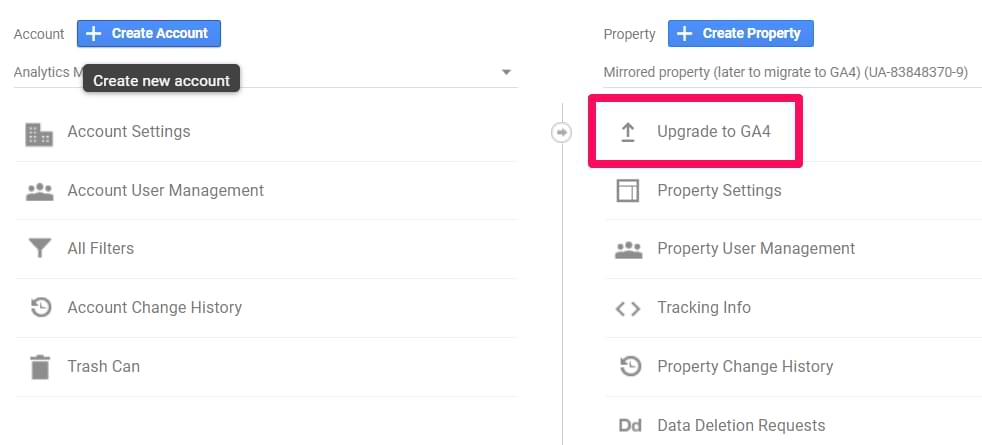
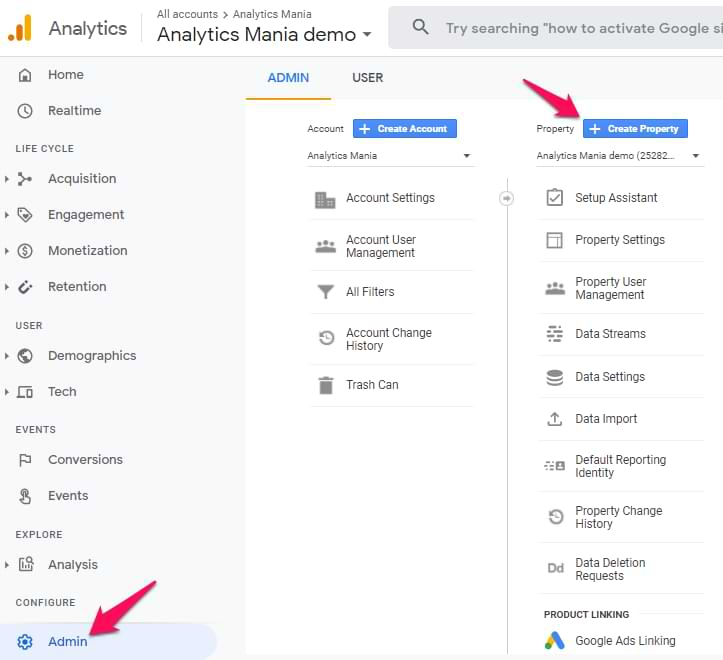
Kickstart updating to GA4 by navigating to your admin settings within your GA account. For this, visit the Admin option under Property Settings. Check for the “Upgrade to GA4” option, and click on it.
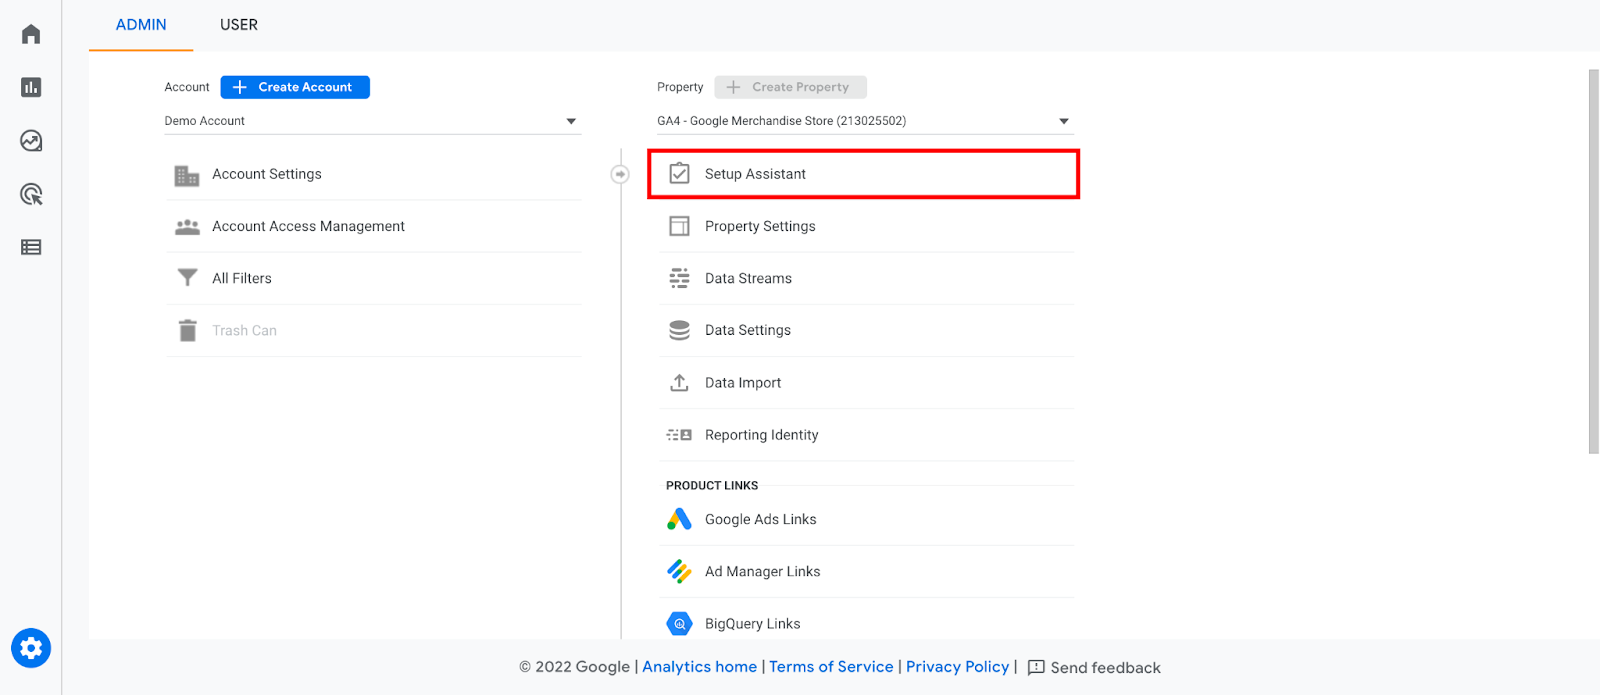
Once you are ready for the update, use Google’s Setup Assistant, which offers a simple upgrade method to a GA4 property. To access the assistant, click Admin, followed by GA4 Setup Assistant in the Property column’s tab.
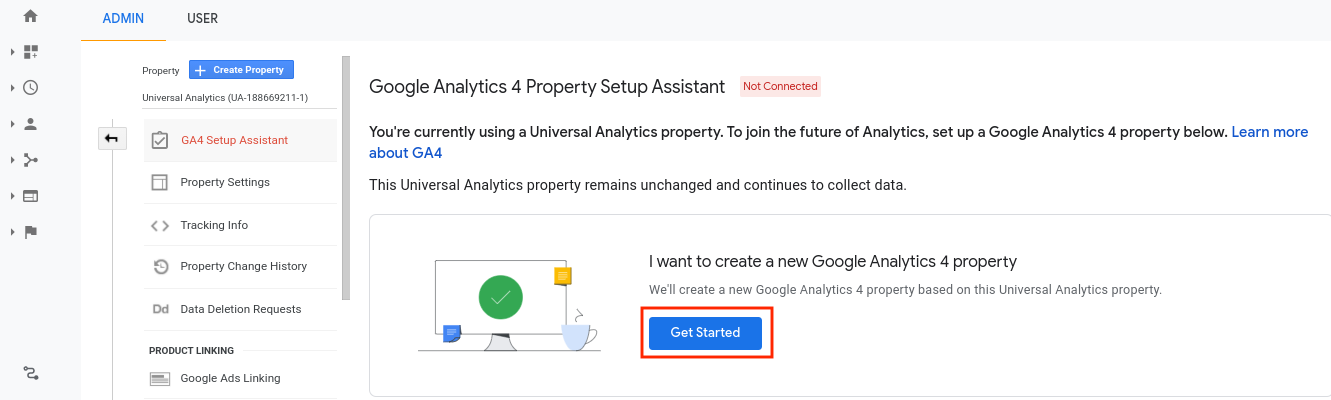
Next, you’ll see a new screen. Here, click on ‘Get Started’ when prompted.
Lastly, choose the Create Property option. The status of the last choice depends on the tracking tag version you’re using.
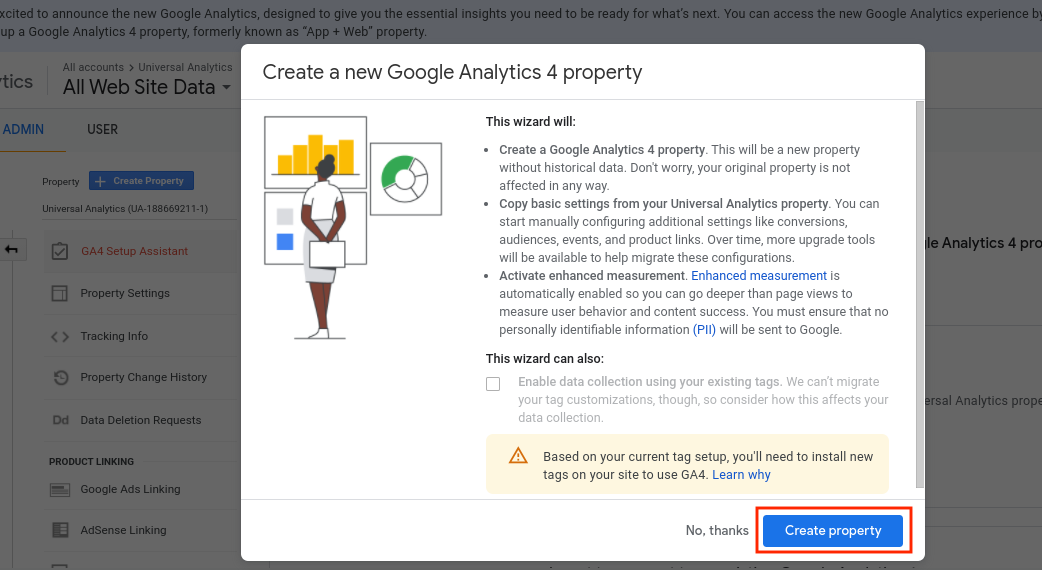
This is it, you are now done with adding a Google Analytics 4 property to your Universal Analytics property.
Begin with creating a new property in your Google Analytics account, specifically for GA4 tracking. Navigate to the “Admin” section of your account by selecting “Create Property” and then choose “Google Analytics 4” in the “Property Type” dropdown menu.
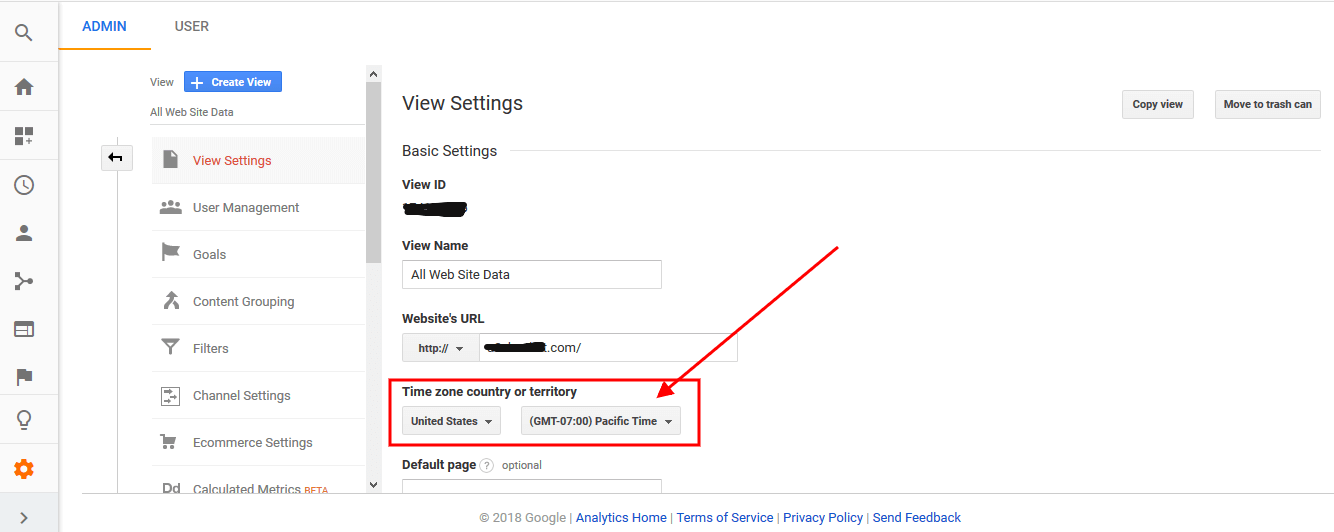
First, give the location a name (such as “My Business, Inc. website”), then choose the local time zone and currency for your reports. If someone from another time zone visits your site on Tuesday, it will be logged as a visit from Monday (as per your local date).
Click ‘Next’ to proceed. And then, choose the kind of company you own and the size range in which you operate. When ready, use the Create button upon agreeing to the analytics Terms of Service and the Data Processing Amendment.
Once your new property is created, you must install the updated tracking code on any website or app where data collection is needed.
To do this, open up your new GA4 property and select “Tracking Info > Tracking Code” from the left-hand side navigation menu.
Copy the provided Global Site Tag (gtag.js) code and paste it into all applicable webpages/apps just above the closing <head> tag.
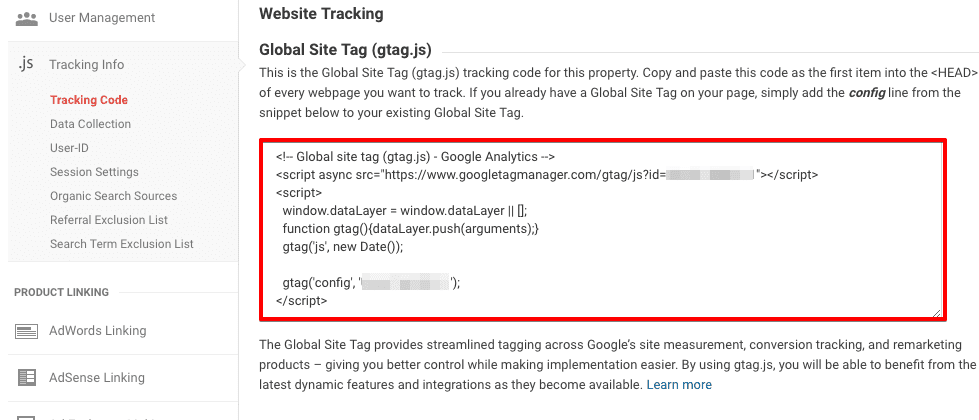
Make sure that each page or app has its unique tracking code. Refrain from using single code across multiple pages/apps since it may lead to inaccurate data collection.
Once you set up everything in your GA4 property, it’s time to send data! To check that everything is working correctly, open up one of your pages/apps with the updated tracking code and use a tool like Google Tag Assistant or Chrome Lighthouse. This is to validate that data is being sent correctly from each page/app with no errors or issues.
When everything goes smoothly, you have completed upgrading to Google Analytics 4!
GA4 is designed to provide more insights and better data tracking than previous versions. Get the most out of GA4 by enabling and setting up important features such as Events, User Properties, and Enhanced Measurement.
These features provide more detailed data about user interactions on your website, allowing you to understand user behavior better and optimize your website for improved results. Additionally, setting up these features can help you to gain more insights into your website performance and make more informed decisions about your digital marketing strategy.
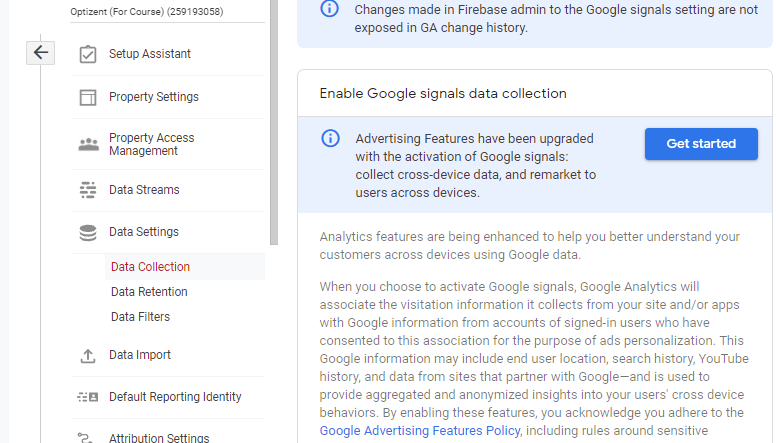
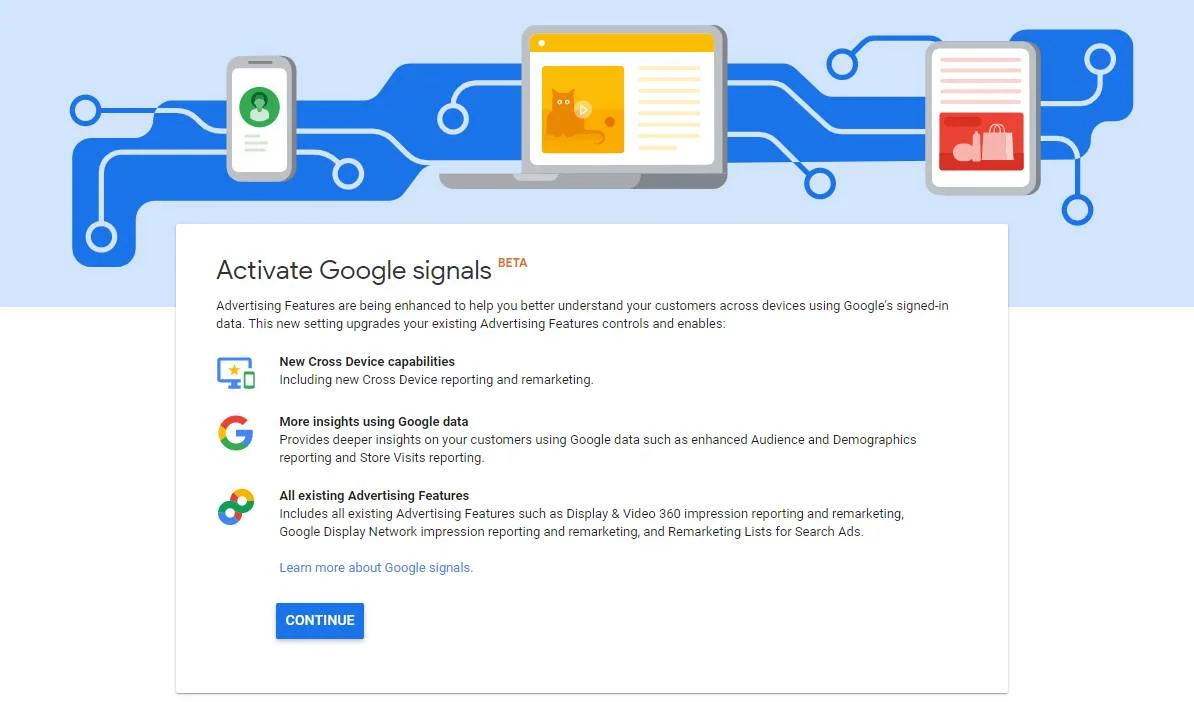
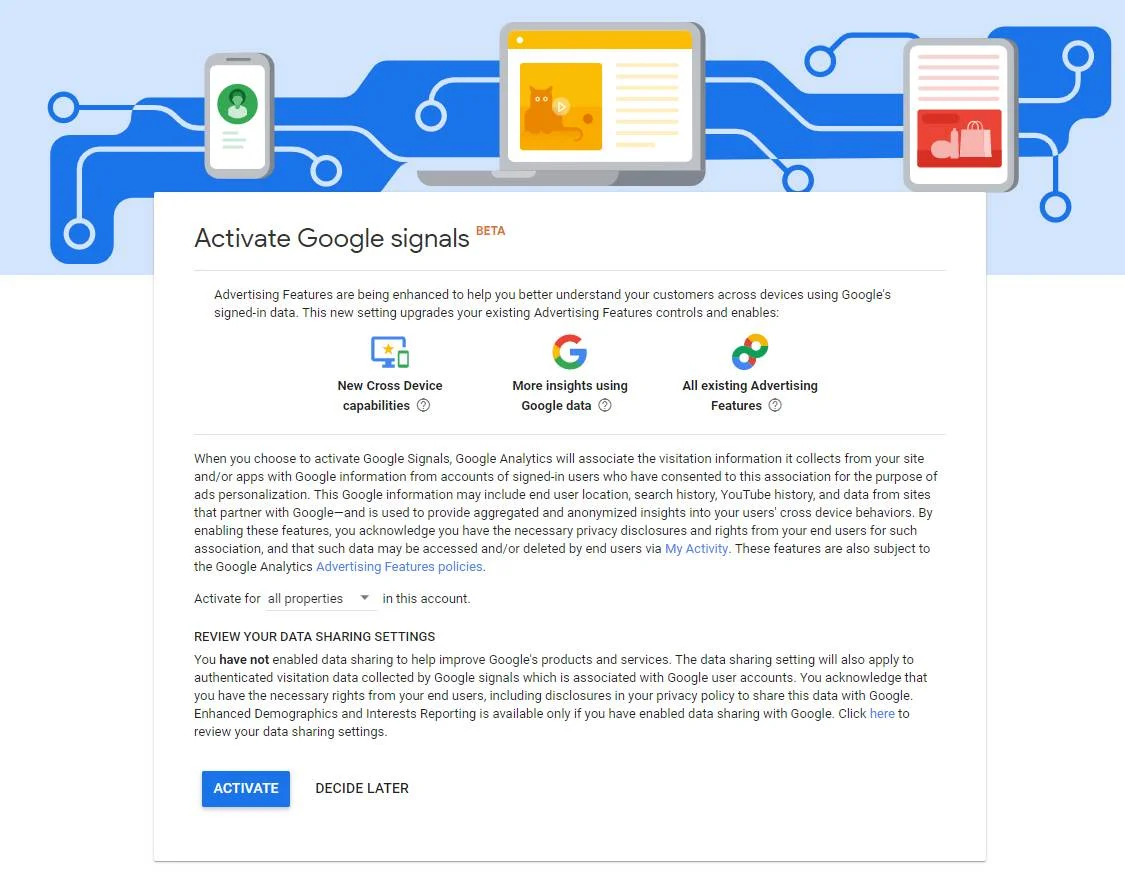
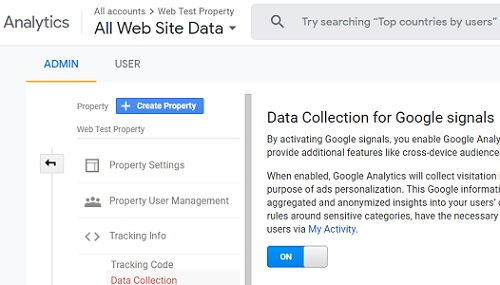
Google Signals are a set of features available in GA4, enabling webmasters to collect users’ data who are signed in to their Google Account (e.g. Gmail) and have enabled Ad Personalization. Once you enable Google Signals in GA4, you can collect the user data and tie it to GA4 reports.
Enabling Google Signals in GA4 helps you render the following benefits.
To enable Google Signals in GA4, follow the steps given below
Data Retention in GA4 provides controls that allow you to set how long Google Analytics will retain user and event data for your app. It lets you decide the length of time before Google Analytics automatically deletes user and event data associated with your app. This feature helps you comply with data privacy regulations, as well as helps you manage storage costs.
Google Analytics 4 (GA4) stores data for a default of 2 months. You can visit Exploration and check out the data for the last two months. You may make a year-over-year comparison by adjusting the time frame to 14 months.
If you want to change the Data Retention time frame in GA4, consider following the steps mentioned below
1. Sign in to your Google Analytics 4 account.
2. Navigate to the Admin tab.
3. Choose the Analytics property for which you want to change the setting.
4. Go to Property and click on Data Settings > Data Retention
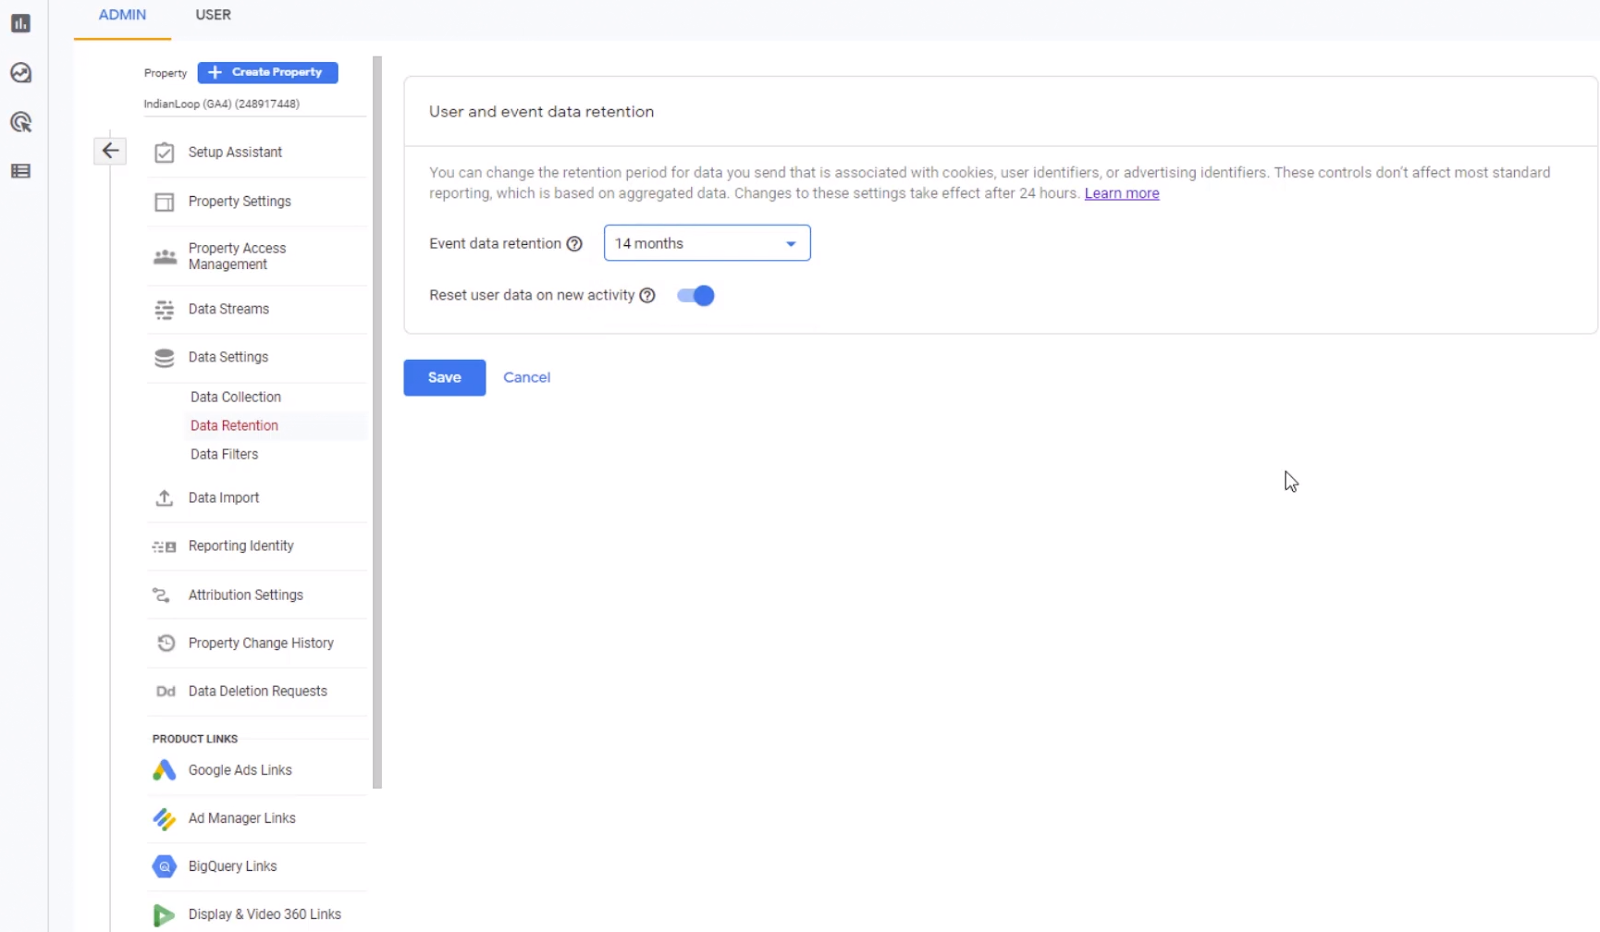
5. Select the desired time frame for data retention.
6. Click Save Changes.
7. Confirm that the new data retention time frame has been applied by navigating to the Data Retention section again.
You may track user actions on your site using “Events.” Page loads, links clicked, and purchases made are all measurable examples of interactions with events.
The following types of events are collected automatically—
The following sorts of events must be implemented for Analytics to display them—
Note: In GA4, even Hits (Pageview hit, Social Interactions hit, etc.) are replaced with Events, allowing you to track whatever you’d want.
Events can be sent to Google Analytics with parameters. Parameters are extra pieces of information that are tied to the event. For example, the page_view event is sent to your reports with the page_location and the page_referrer parameters.
The page_location parameter lets you see the URL of the page that someone viewed, and the page_referrer parameter lets you see the URL of the previous page they viewed.
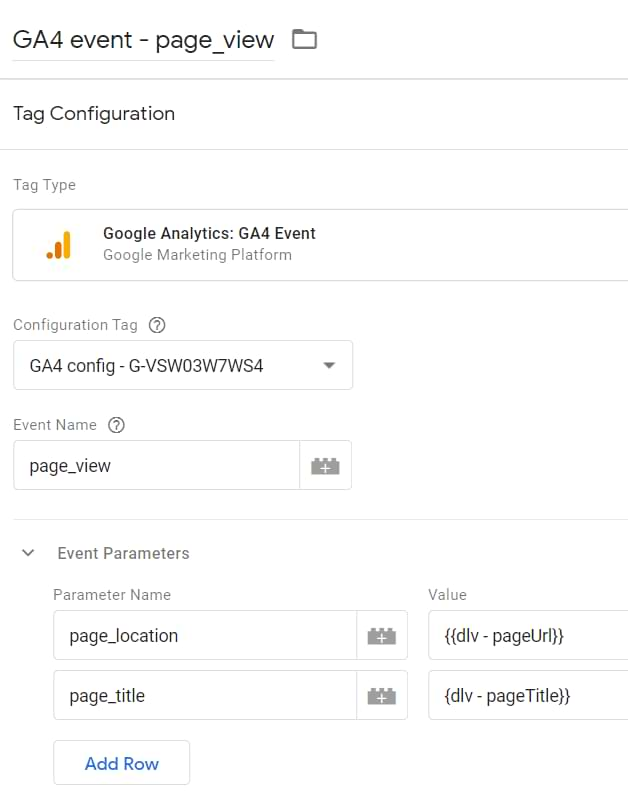
Here’s what a page_view event looks like in Google Analytics, along with the parameters:
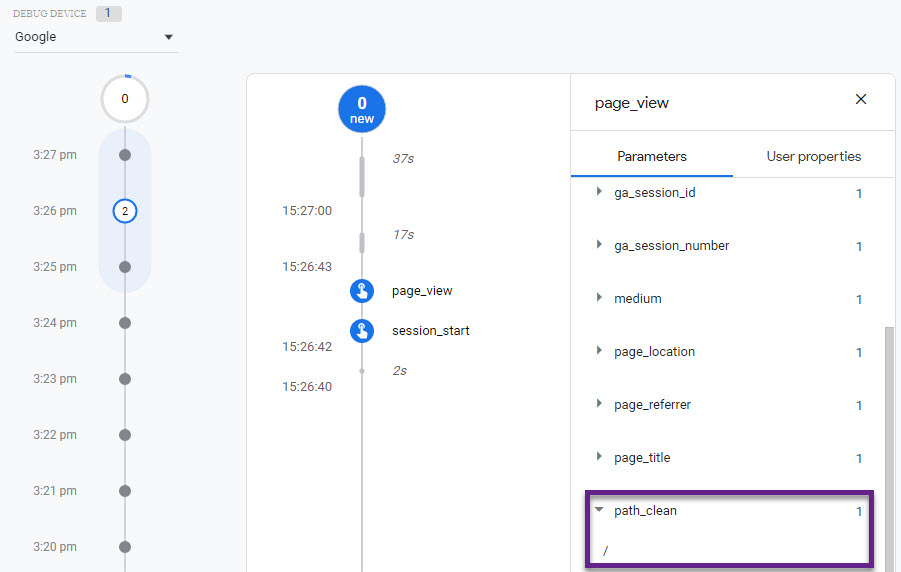
Google Analytics automatically sends a set of parameters with each event, including the ga_session_id, page_location, page_title, and page_referrer.
To keep tabs on what happens on your site once a visitor clicks on a link, including the Google Analytics 4 tag. For instance, when a user stays at least 10 seconds on your website, Google Analytics will record it as an event.
In addition to the automatic events discussed, you can use Enhanced Measurement, an option that collects additional data. This feature is set up for each data stream that sends information to Google Analytics.
Navigate to Admin > Data Streams > Select the web data stream. Next, a window will open which shows you a section called Enhanced Measurement.
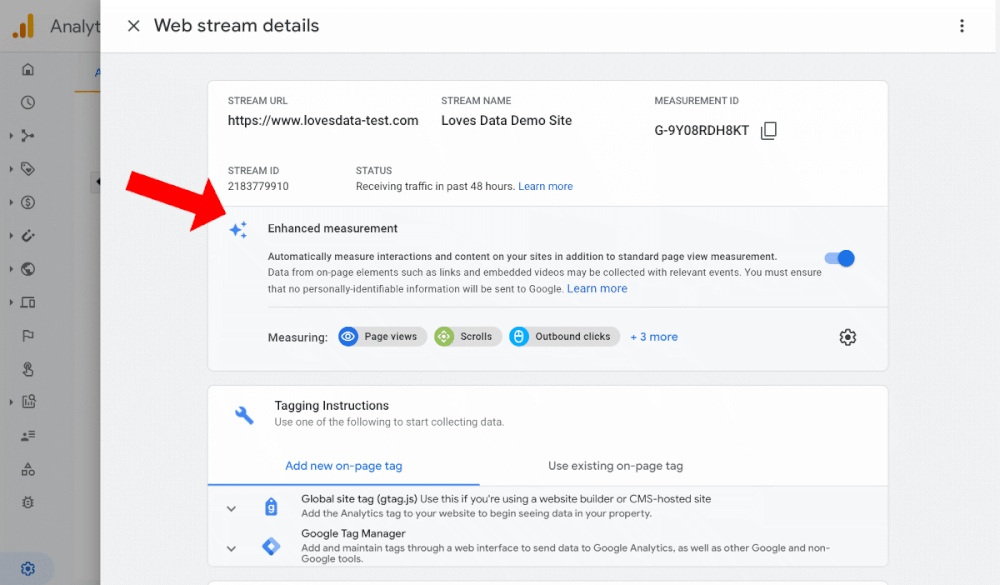
Marketers can take advantage of Enhanced Measurement Events to get more events in their reports without needing assistance from developers. Also, they do not need to set up anything with Google Tag Manager.
By default, this functionality is activated and will automatically monitor the following events:
You may turn on or off any of the events by using the settings icon in the Enhanced Measuring section.
Enhanced Measurement additionally offers extensive configuration options for automatically gathered page views and site search events. You may deactivate the ‘Page changes based on browser history events’ option for page views.
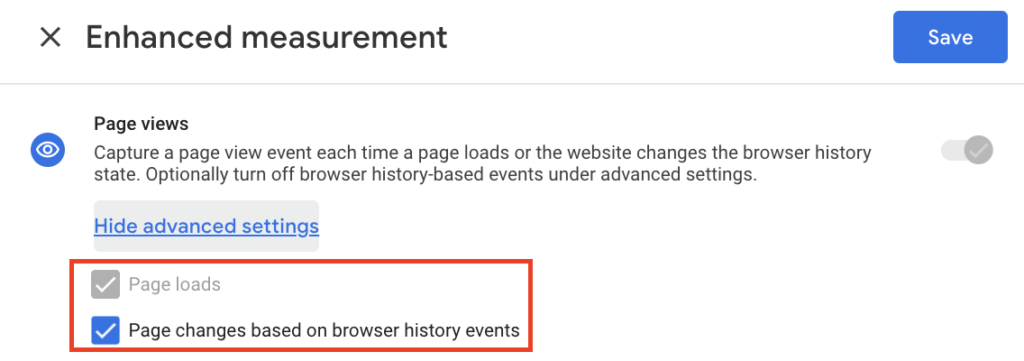
This setting will default keep tabs on page visits even if the URL is changed or new content is inserted into an existing page.
GA4 reports are a set of analytics reports from Google Analytics 4 designed to help them better understand their content’s performance. The following reports provide insights into how people interact with content, such as how much time they spend on pages, how often they return to the website, and which content is most popular.
1. Conversion Paths Report: A report that allows content publishers to identify visitors’ paths to complete conversions.
2. Conversions Report: This report provides a detailed view of how users are converting on a website. Publishers can use this report to track ad campaign conversion and other goals like video views, newsletter sign-ups, video views, and eCommerce transactions.
Also, it simplifies comparing different ad campaigns and identifying the successful ones and the ones that need improvement.
3. Demographic Details Report: This report provides detailed information about the demographic characteristics of website visitors. It includes data on gender, age, education level, and other demographics.
4. Ecommerce Purchases Report: This is a useful report which provides data about ecommerce purchases made on a website with data on product purchases, revenue, average order value, etc.
5. Events Report: Events report provides an overview of the events being tracked on a website, including data on event categories, the total number of events, and other metrics.
6. Firebase Report: This report provides an overview of the Firebase analytics data that is being collected on a website. It includes data on user engagement, app usage, and other metrics.
7. Google Ads Campaigns Report: A useful report for content publishers to optimize Google Ads campaigns based on key data like impressions, clicks, cost, etc.
8. In-app Purchases Report: Understand user behavior with this report since it provides an overview of the in-app purchases with insights on product purchases, revenue, average order value, etc.
9. Landing Page Report: This is a useful report to get an overview of pages used as landing pages on a website. It includes data on page views, conversions, bounce rate, etc.
10. Model Comparison Report: This report allows content publishers to compare different models to see which models perform better based on data like impressions, clicks, cost, etc.
11. Order Coupons Report: This report provides an overview of the order coupons used on a website with insights on data like order coupon redemption, average order value, etc.
12. Pages and Screens Report: This report provides an overview of the pages and screens used on a website with metrics like page views, time spent on a page, etc.
13. Performance Report: This report provides an overview of a website’s performance based on metrics like page load time, page size, etc.
14. Publisher Ads Report: This report provides an overview of the publisher ads used on a website with an analysis of metrics like impressions, clicks, cost, etc.
15. Realtime Report: This report provides an overview of the real-time analytics data collected on a website based on data like users’ geographic location, user engagement, page views, etc.
16. Retention Reports: This report provides an overview of how users return to a website based on key metrics like returning users, average session duration, etc.
17. Tech Details Report: A useful report that provides an overview of the technical details of a website — page load time, page size, etc.
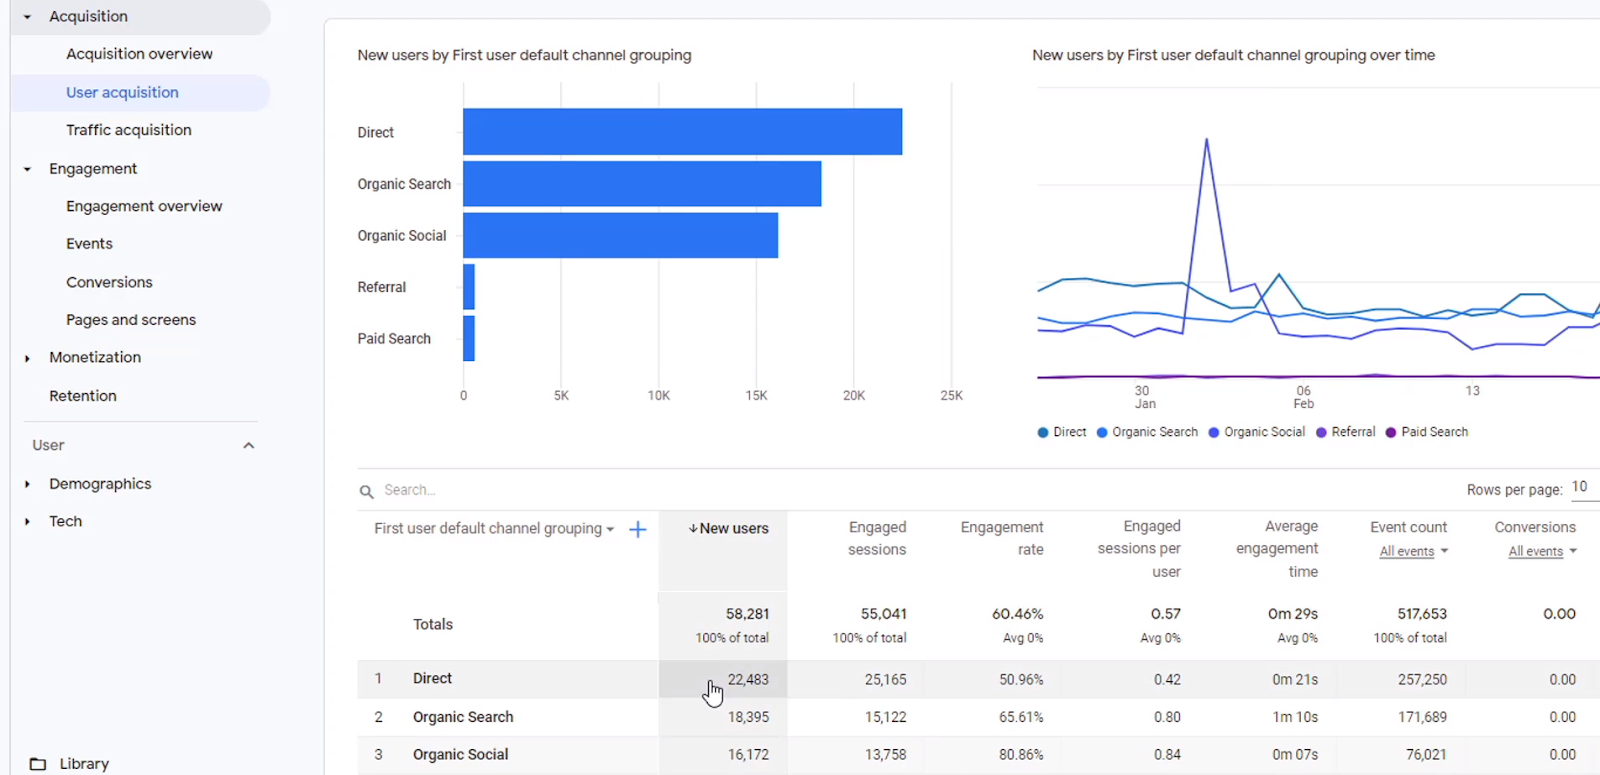
18. Traffic Acquisition Report: Content publishers can leverage traffic acquisition reports by getting insights on organic search, referral, and other sources.
19. User Acquisition Report: This report provides an overview of how users are being acquired on a website. It includes data on user signups, returning users, and other metrics.
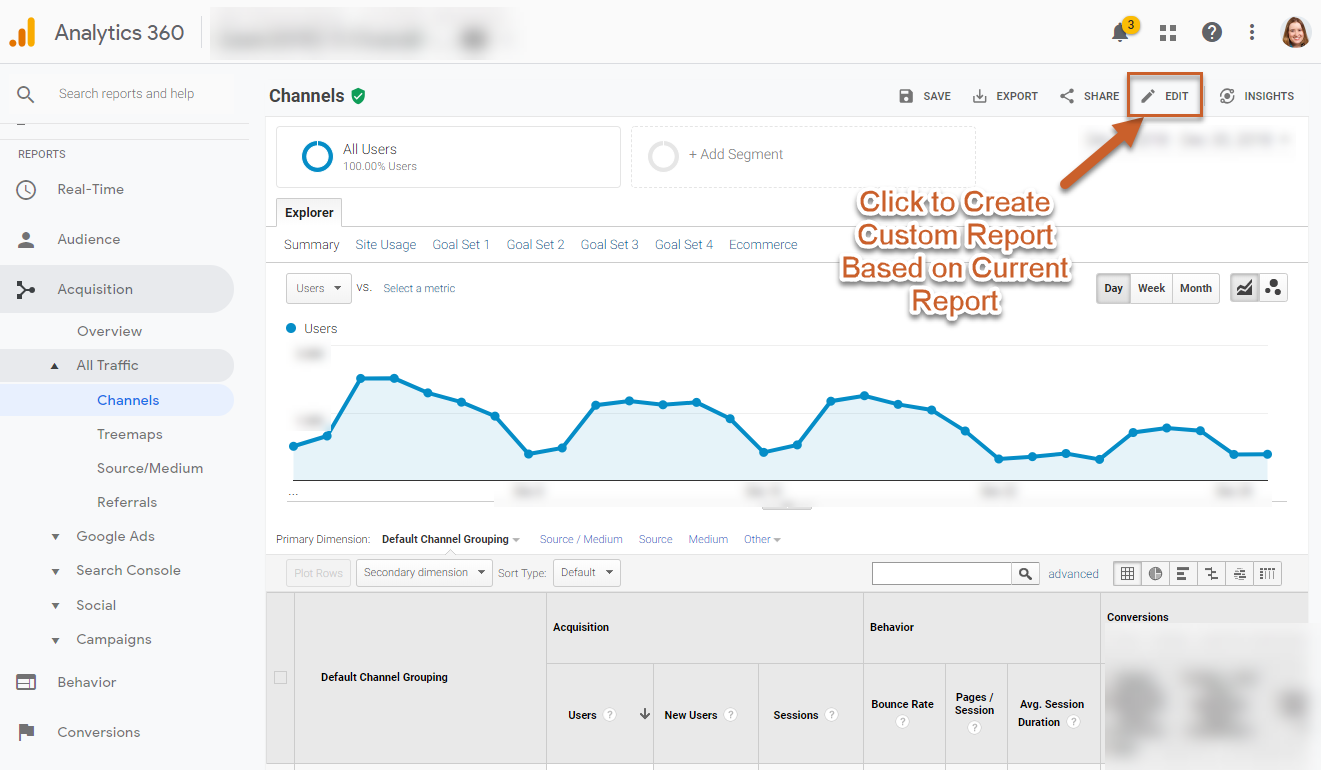
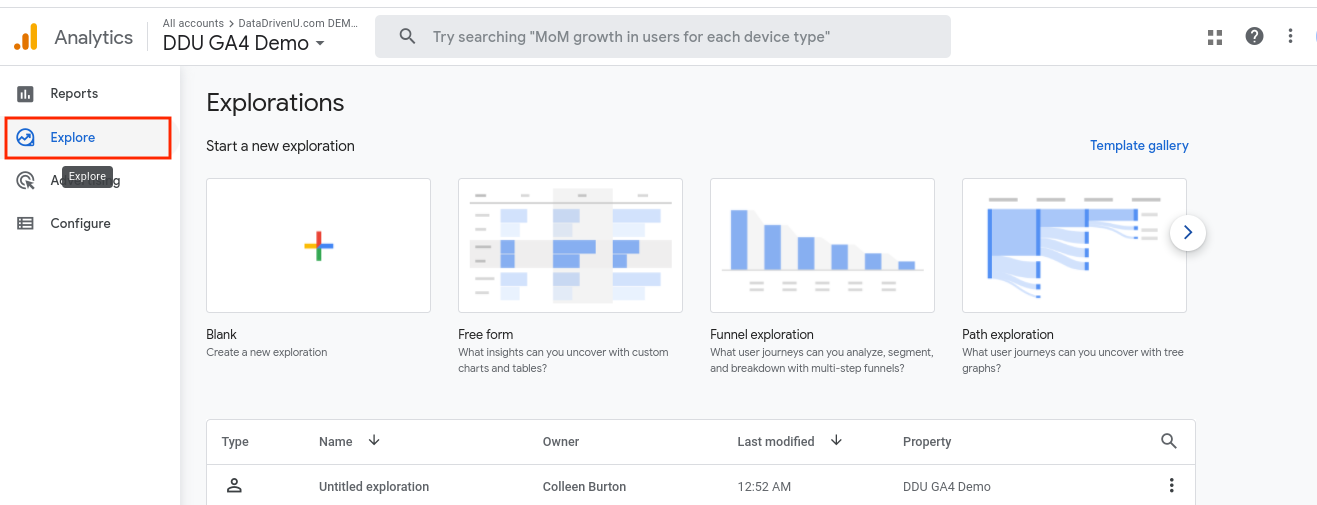
Earlier in Google Analytics, users could create their reports under the heading Customization > Custom Reports. But, with Explorations in Google Analytics 4, things are more simple.
Some of the readily available reports in GA4 can be seen below—
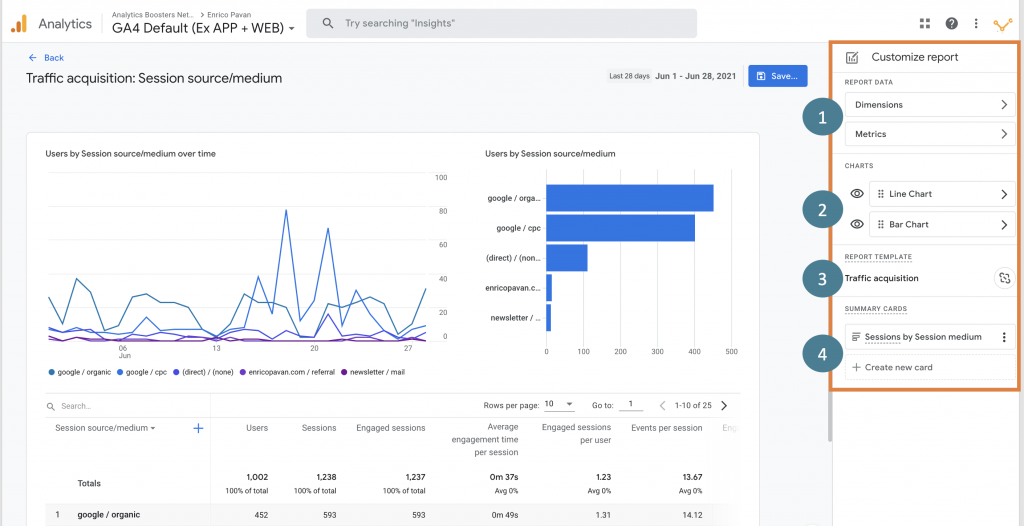
Here are some of the quick steps you can take to create a standalone custom report in GA4—
Step1: Click on the edit icon as shown below
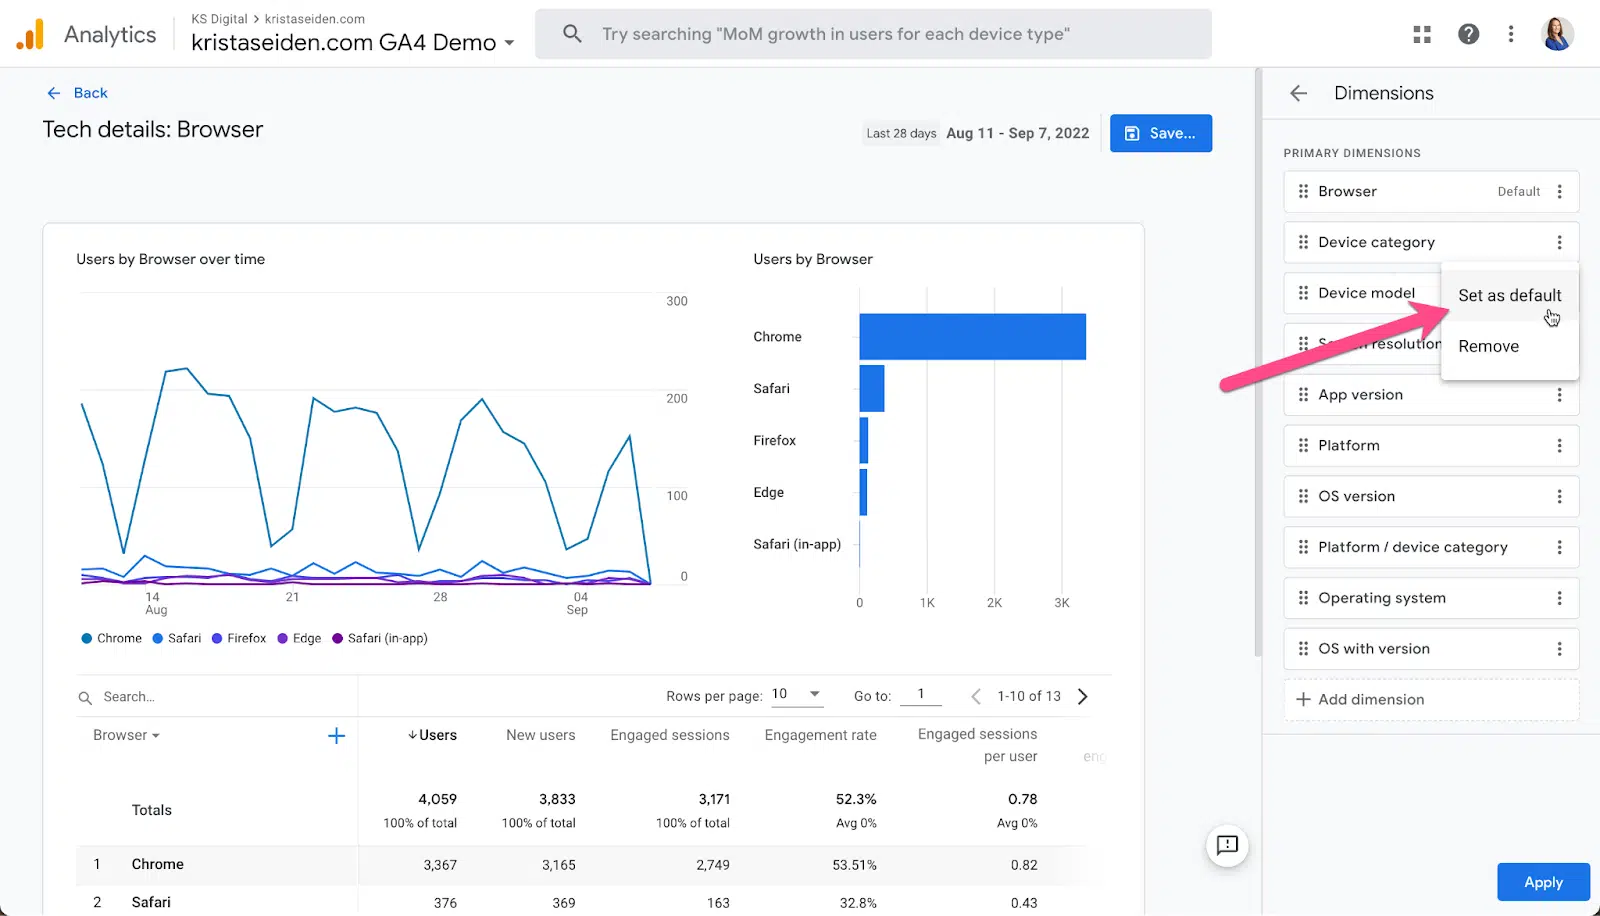
Step 2: Choose from the list of available Dimensions. If needed a new dimension, head to Step 2A.
To make the selected dimension a default, simply click the ellipsis (…) on the right, then choose Set as default for the Device Model category, and then click Apply.
Step 2A:
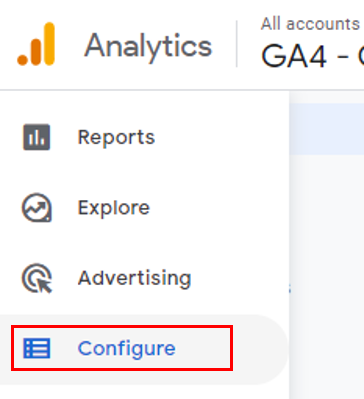
To edit custom dimensions, navigate to your GA4 property view and then click on the ‘Configure’ link:
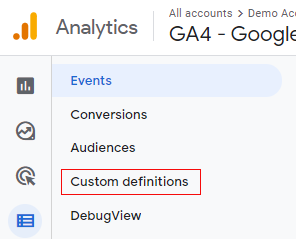
Next, click on custom definitions
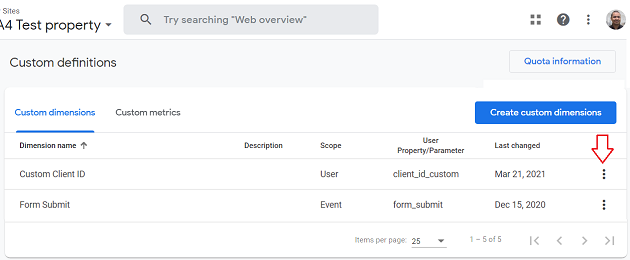
Next, click on the three dots menu to explore the custom dimensions you need to edit
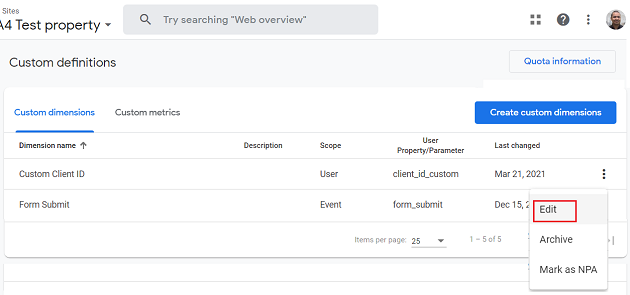
Later, click on Edit options
Now that you’ve created a custom dimension, you may give it a new name and modify its description.
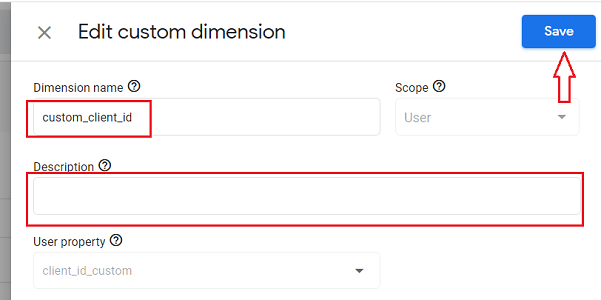
Then choose “Save” from the menu:
Now, this custom dimension will appear in the list (as shown above)
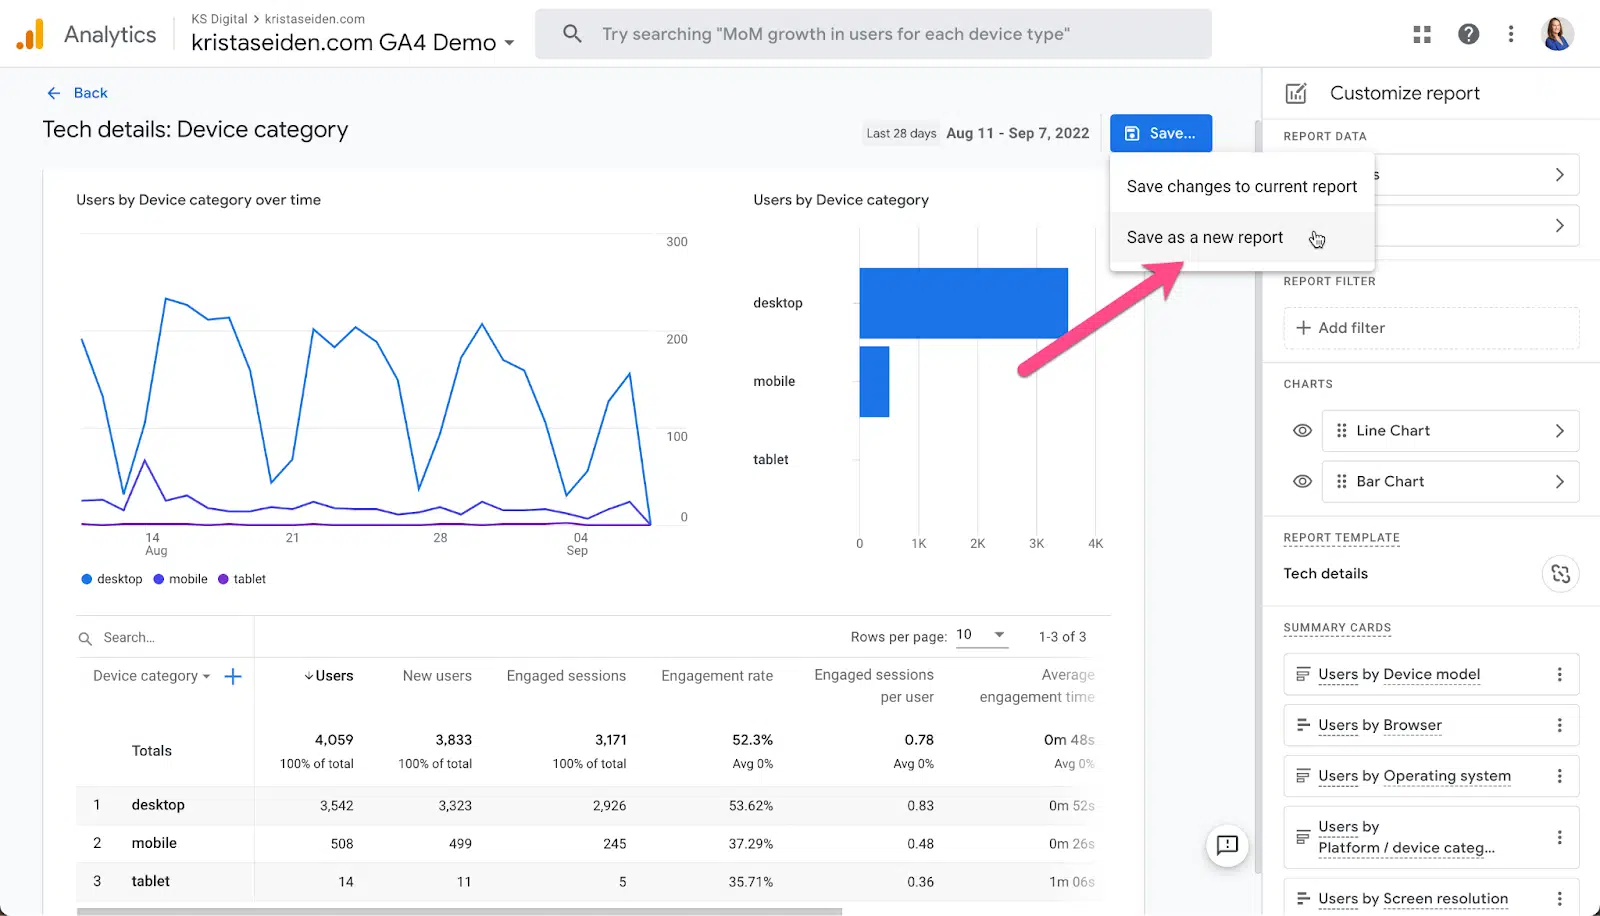
Step 3: Select “Save as new report” from the drop-down menu and hit “Save” to finish. You can label it for quick reference. Here, it is labeled as ‘device category’.
This is it! You are done with creating a report in GA4.
Content grouping in GA4 enables grouping content into a logical structure. It helps group related content together to analyze and report on your website data. Content grouping enables segmenting content by page type, page topic, or any other criteria you define. This allows you to easily compare different content types and better understand how your visitors interact with your website.
Some of the common content groupings involve —
1. Grouping by page type: Organizing pages into groups based on their type. E.g; product pages, blog posts, list pages, etc.
2. Grouping by user type: Grouping webpages groups based on the type of user visiting them — new users, returning users, referred users, etc.
3. Grouping by user action: This grouping involves segmenting pages into groups based on the user action such as page views, purchases, and form fill-ups. etc.
Content Grouping in GA4 requires using Google Tag Manager and Google Analytics 4 configuration tags.
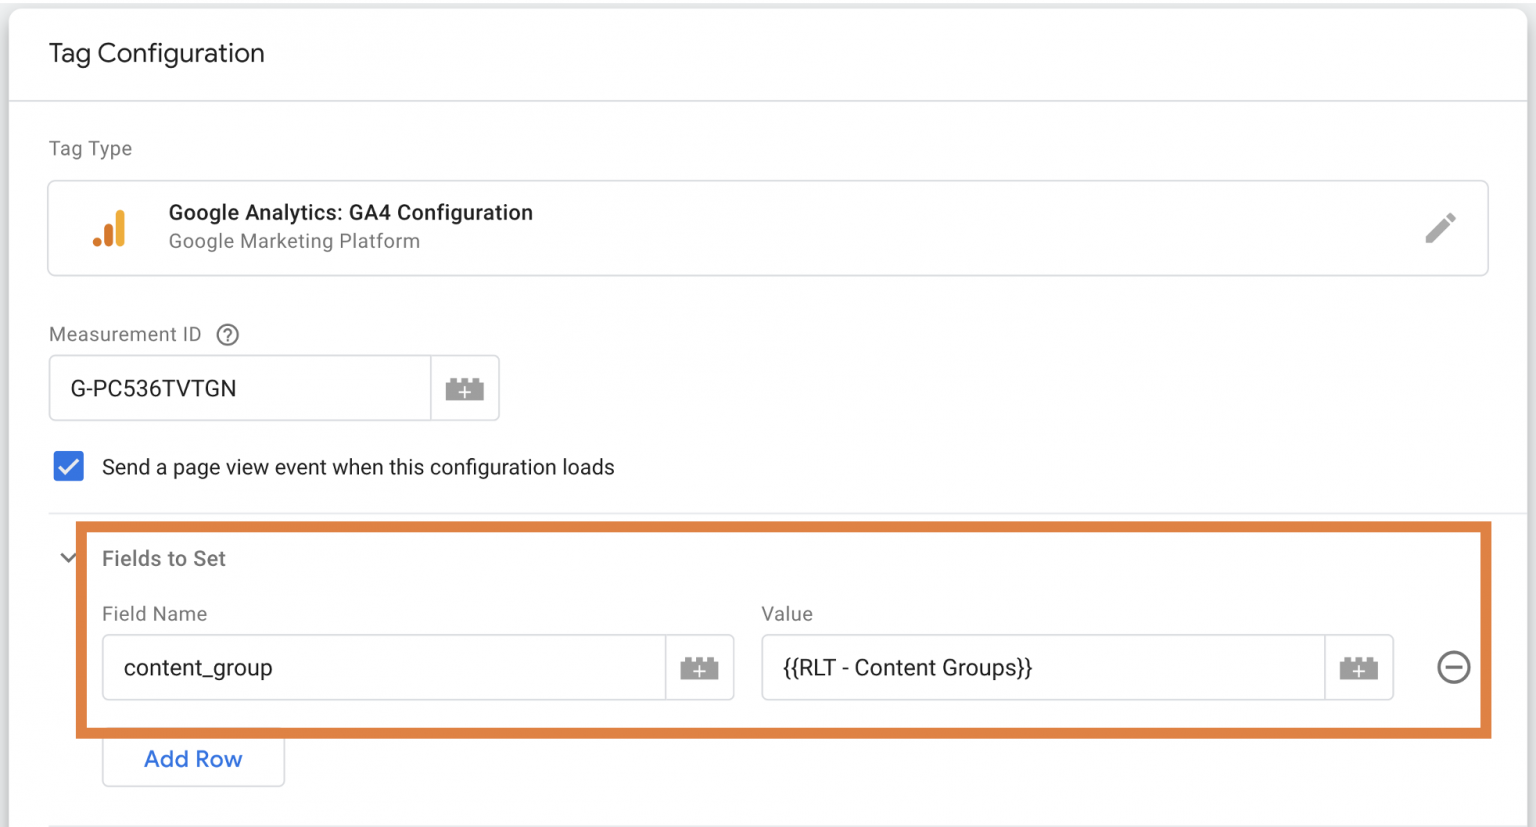
Step 1: Launch Google Tag Manager and access/create a new GA4 configuration file.
Step 2: Add “content group” as a parameter and the content you wish to link to it in the “Fields to set” section.
Since this one is based on page views, the parameter-based content will be dynamic.
One option is to set up a custom event in which the page category is always provided as a variable, while another is to establish a Regex LookupTable in GTM and send the {{Page Path}} as a variable.
Step 3: Repeat the same by triggering it across your website’s web pages.
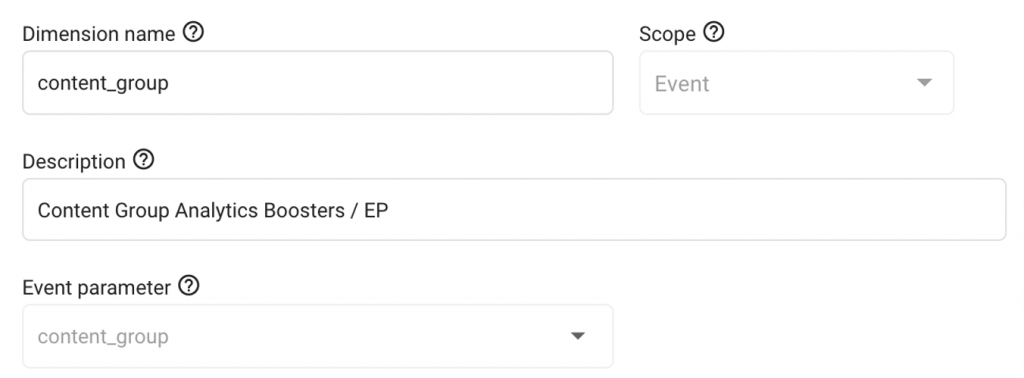
Remember to add content_group to the custom dimensions in your Google Analytics 4 to access it in any further reports.
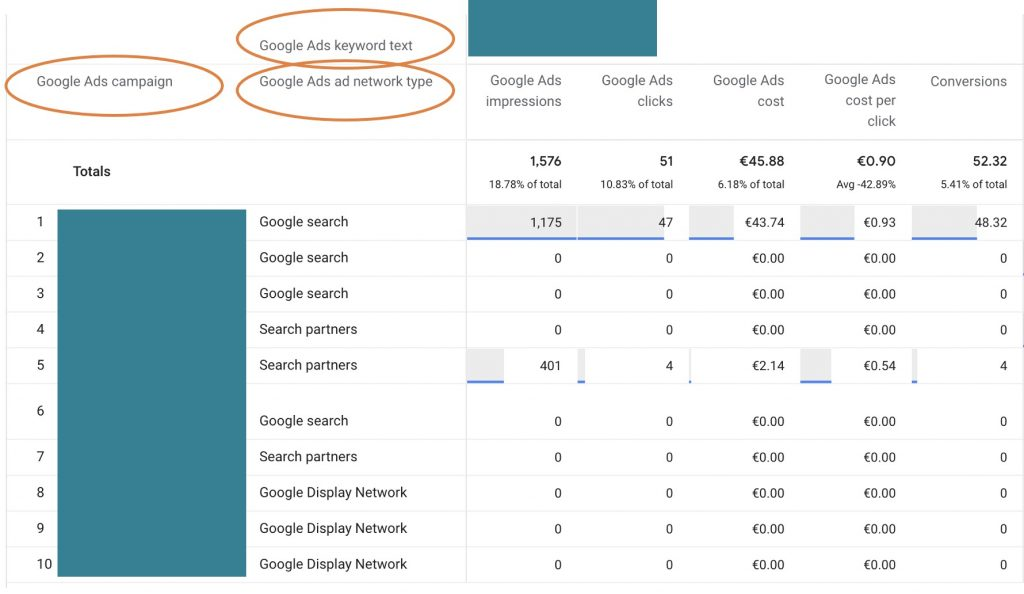
You can access Google Ads Report in GA4. Get an in-depth analysis of an advertiser’s campaigns and performance since it provides insights into how well campaigns are performing, It also helps advertisers to optimize their campaigns for better performance.
The report includes a detailed overview of an advertiser’s campaigns, such as impressions, clicks, conversions, cost per click, cost per conversion, and more. It also provides data about the types of users that are clicking on the ads and how they are engaging with the ads.
GA4’s extensive array of available dimensions and metrics makes it possible to tailor-make reports with great precision and depth.
Navigate to the Exploration section of Google Analytics 4 and choose “blank.” Then, in the “Technique” drop-down menu, click “Free Form,” and the table will appear.
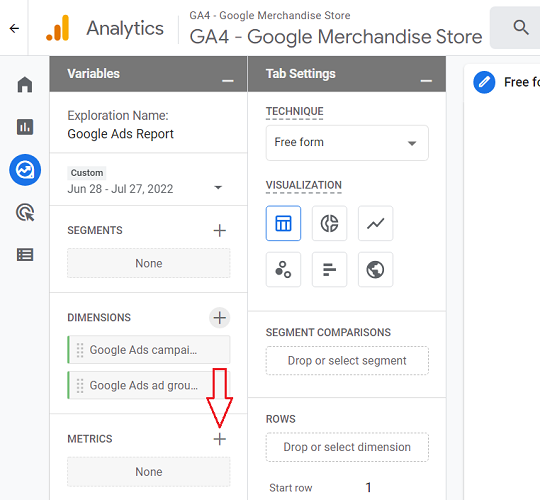
Choosing Metrics
Now, you have to pick the metrics to publish. Simply expand the first column by clicking the plus sign at the end of the “Metrics” section.
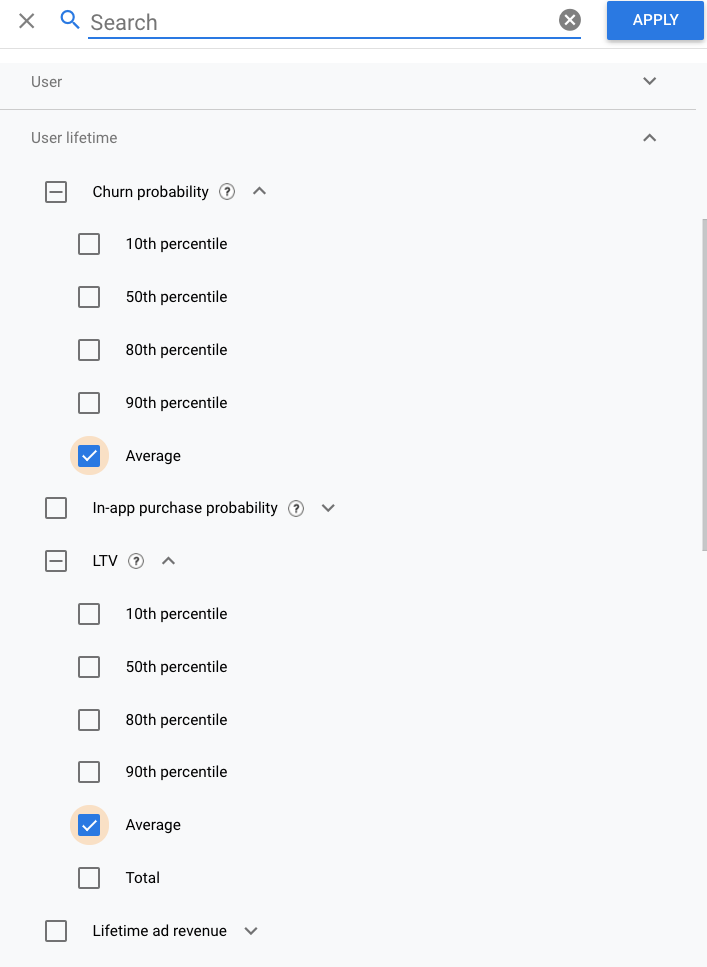
Metrics will load in a new layer on the right. Use the built-in search bar to look for “Google Ads,” then choose the checkboxes and metrics seen in the following snapshot and hit the “Apply” button:
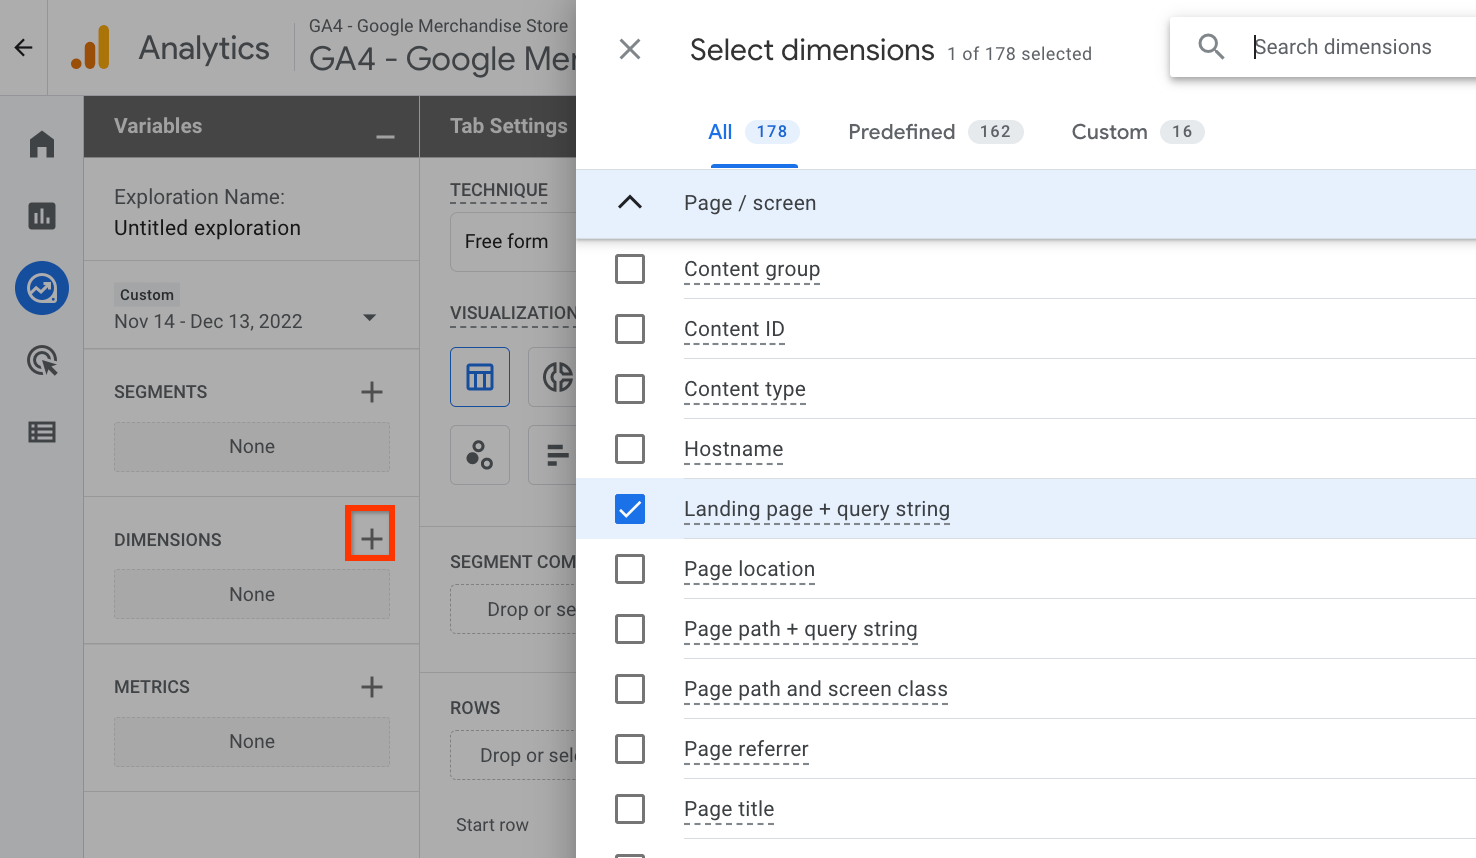
Select the row dimension(s) you want to use now. Go to the Dimensions tab, click the Add button, and then use the search bar to locate and choose the relevant Google Ads dimensions.
A dimension may be used as either a row or a column, making it feasible to build a pivot table.
After entering the dimensions in the rows and columns and the metrics in the values section, the following report will be generated:
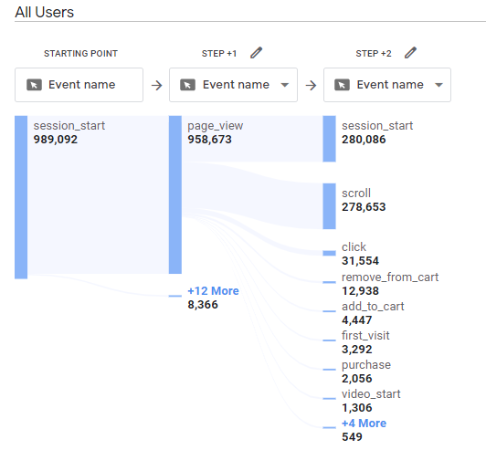
This is a report template in GA4 that shows visitors’ sequence of events before converting to a website. It displays all the pages visited by users before they complete an action, as well as the order in which they were accessed.
The report also shows the number of people who completed each step of the journey, the average time spent on each step, and the conversion rate for each step.
The path exploration report can be used to observe user behavior patterns, such as looping between pages. For example, if a user is continuously viewing page A, then page B, and then page A again.
An example of a path exploration report could look like this—
In GA4, event tracking is enabled by default, meaning it will start recording data when Tag Manager is configured and set up. This differs considerably from Universal Analytics, where event-tracking features must be manually enabled.
To avoid having the same event data that appear in both GA4 and Universal Analytics, ensure that event tracking has been removed from Universal Analytics and enabled in GA4. This will allow you to collect the necessary information without duplicating data in either system.
Usually, users need to register custom parameters before sending them to Google Analytics 4 to use them as custom dimensions in the interface. Beginners sometimes get confused about registering for custom events, leading to duplicate data. Therefore, there is no need to create custom events.
If the same event is registered for both Google Tag Manager or Global Site Tag (GTAG) and the “Create event” feature, it will be counted twice.
The data retention duration is set to two months by default. This choice affects the advanced reports in the Explore section but not the data in the normal reports.
Keeping it for two months will significantly affect your data analysis. In such a situation, it becomes challenging to analyze your data for more than two months in this part.
There are two reporting features/modules in Google Analytics 4: standard reports and explorations. The data in standard reports do not expire, but things are different in explorations. By default, you can work only with the data from the last 2 months.
That is only possible by default if you extend the data retention period from 2 months (default) to 14 months.
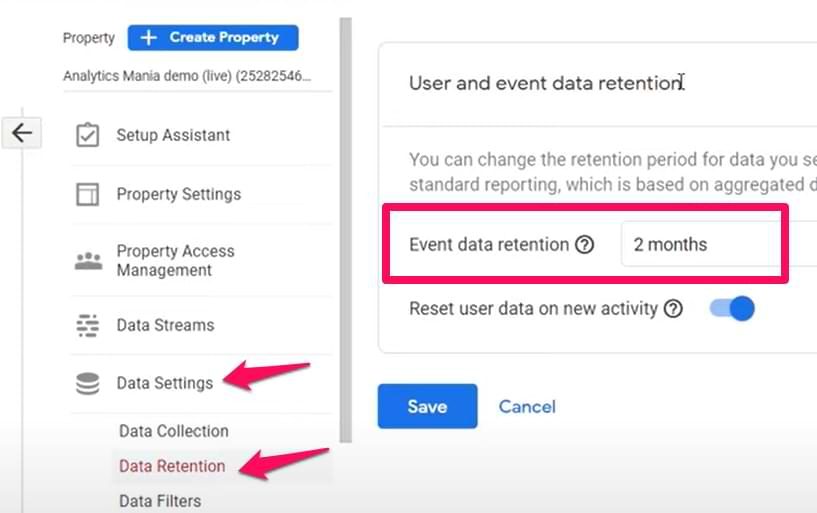
This is something that every GA4 user has to do when a new property is created. Go to Admin of your GA4 > Data settings > Retention and change to 14 months. Keep in mind that this change does not apply to historical data. Your 14 months start when you change that setting.
When you’re done configuring GA4, your account won’t be linked to other Google services like Search Console or Ads. This is a must if you want to get useful data from your Google Ads search query reports and maintain a healthy remarketing audience that is always growing.
Before syncing Google Analytics with other Google products, ensure that the GA4 email address you use has admin access to those other Google products. You may locate products to synchronize in the Admin > Product Links menu.
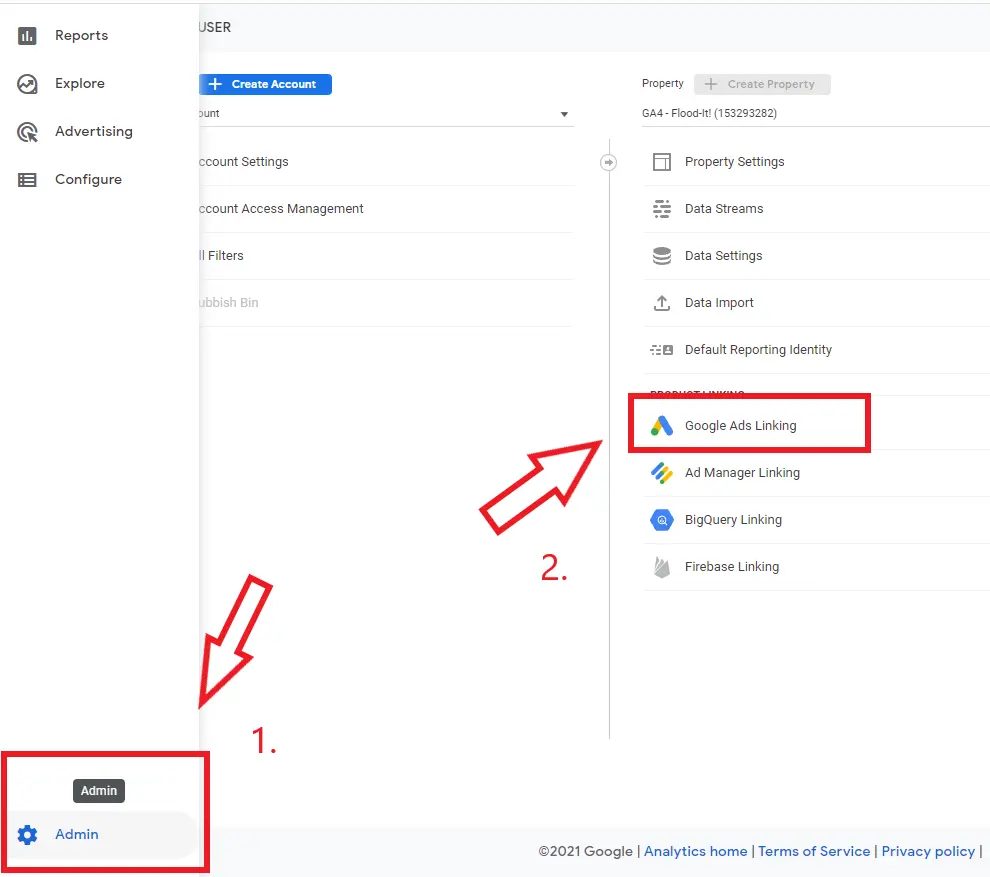
You will find Big Query, Merchant Center, and many more that you may integrate with your data!
Connecting your account is as simple as clicking the “Link” button after selecting your desired Google product.
Users logged into Google and enabled Google Signals in their account settings will have their data collected. Insights regarding your audience’s demographics, interests, and other aspects may be gleaned from this information. Demographic signals are disabled by default, this requires digging into some of the key reasons that are responsible for it.
Google Signals (and thus Demographics reports) would not function if GA4 was installed with server-side GTM. Currently, there are no options for dealing with this situation.
Decide on whether to use GA4 along with server-side tagging (with no demographic data) with demographic data or GA4 With server-side tagging (without demographic data) (but without server-side setup).
If your Google Analytics 4 runs on a small website with merely a thousand-odd visitors a week, you will need more than demographics reports to work for you.
The only thing to do is to stop worrying about demographic studies and instead put an emphasis on more pressing matters, such as expanding your website to attract more visitors.
As compared to GA3, the reports in GA4 include more information about the recent data. The standard turnaround time for data release has been shortened to 24 and 48 hours.
It may be longer for demographic information. Hold on a little longer if you just turned it on. However, if it’s been a week or more, another factor is likely at play regarding Google Analytics 4’s missing demographic data.
For publishers looking to get the most out of their website analytics, upgrading to GA4 is the way to go. The enhanced data analysis capabilities, event-based tracking, and user behavior tracking will provide invaluable insights into the user’s experience on the website. Additionally, creating custom reports will allow businesses to focus on the metrics most important to their individual goals.
You can follow the steps above to begin the upgrading process that ensures successful switching to Google Analytics 4.0. Ensure to follow some of the above-explained tips and tricks once you start using GA4. Also, avoid some common pitfalls webmasters succumb to when switching to GA4. Doing so will help you get the best out of your GA4 and render its features to thrust your business.