Publisher growth tactics for election season | WEBINAR

Google Trends is a free research tool that shows the relative popularity of a search term over a given period of time in a specified geography. It does this by plotting a trendline that varies with the relative increase or decrease in the keyword’s popularity over time.

Google Trends does not show absolute search numbers. Instead, it divides the number of search queries for a particular keyword by the sum total of all the search queries in the selected geography and time period.
The resulting number is what each data point on the trendline shown on Google Trends represents.
Google Trends helps publishers spot trends before they begin to take-off, thus enabling them to maximize the reach of their content.
Publishing content to coincide with a rising trend for a topic can significantly improve performance. Conversely, meticulously researching a keyword for search volume, difficulty and search intent only to then publish content after its search trend begins to decline can end up as wasted effort from an SEO perspective.
Google Trends can help publishers discover trending topics, find new niches, plan their content strategy, optimize it for specific geographies and even enhance video content strategy.
Google Trends remains a relatively underused tool by digital publishers for a couple of major reasons.
Unlike several paid keyword research tools, Google Trends does not give numerical data for absolute search volumes, keyword difficulty and other search-related metrics. Instead, it presents information in the form of trends and graphs that represent the relative popularity of a search term over a given period of time. Publishers used to the simpler interfaces of paid keyword research tools may find Google Trends’ graphs and trend lines unconventional to work with.
Google Trends’ deceptively simple interface hides a powerful trend predictor and keyword research tool. Many publishers may not be aware of its full range of features and powerful functionality, which can help uncover a wealth of information about search trends.
Below the most important functionalities of Google Trends that publishers need to be familiar with.
Some topics show a sudden spike at specific times of the year, year after year. For instance, searches for umbrellas go up every year during the rainy season. Sales of Christmas trees shoot up around November-December.
These are known as seasonal topics. Understanding topic seasonality allows content calendars to be optimized for an expected increase in search volume.
Google Trends not only helps identify seasonal trends, but also displays the frequency of the seasonality. This, in turn, reveals two very valuable details in advance of content production:
For instance, we know that searches for Black Friday will spike after Thanksgiving. The graph below shows a spike each year for the search term Black Friday with a cyclical regularity.
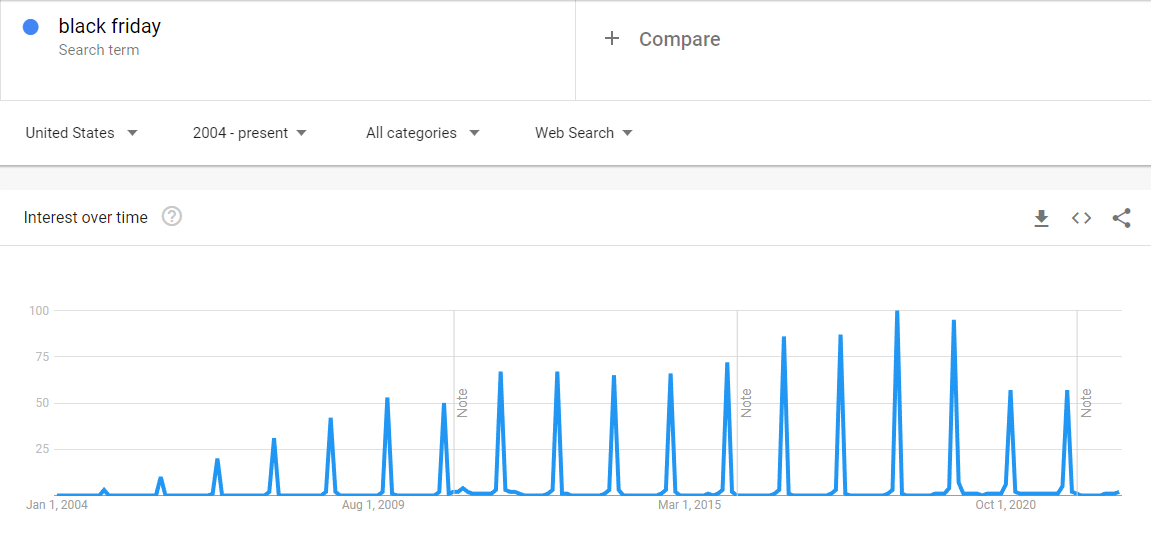
For publishers, this means that writing a new Black Friday post every November is unnecessary. Instead, simply updating old content ahead of the Black Friday surge is enough to capitalize on the yearly surge of interest.
We also know that Black Friday comes once a year, so we only need to update this content once a year. For events that occur more than once a year, this may need to be done more frequently.
Below its trend graph for a keyword, Google Trends displays a list of queries related to the topic you searched for, which were also searched for by other Google users. This is a handy feature that gives you a list of long-tail keywords that you can cover with your content.
This helps in two ways:
Circling back to our Black Friday example, here’s what the list of related queries related to our search term looks like:
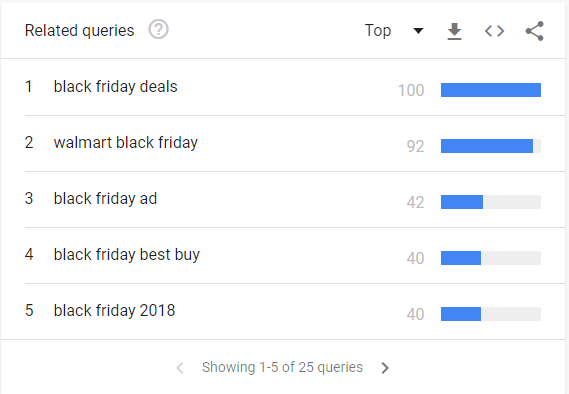
Each of these represents an opportunity for creating more content on a certain topic and answering the most popular queries within that topic.
Each of these keywords can also be further distilled down to your time frame of choice to investigate how their search trends vary with time and reveal even more granular details about search intent.
If you’re a news publisher with a focus on content with a shorter shelf life, it’d be helpful to narrow down your time frame to between 1 hour to 7 days to find the most relevant trends.
Pro Tip: Use the Keywords Everywhere browser add-on for Chrome and Firefox to receive even more detailed data for Related Queries, including monthly search volume, cost per click (CPC) and competition.
In the screenshot below, we can see that below each Related Query, Keywords Everywhere displays four bits of information — the monthly search volume for the last month, CPC, competition measured on a scale from 0 to 1 signifying the number of advertisers running ads for this particular query on Google Ads and a chart displaying monthly search volumes for the last 12 months.
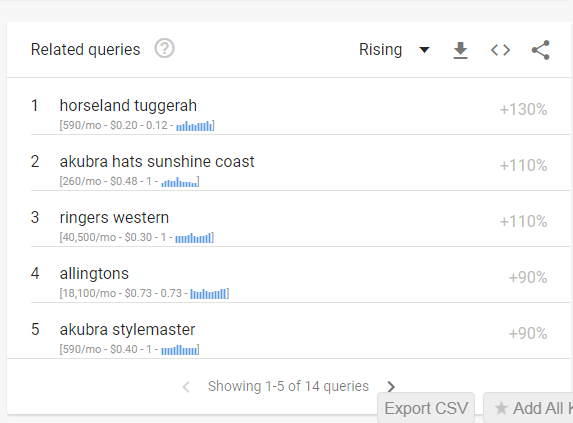
What’s more, users can even save this data on their systems for offline analysis by exporting it as a CSV.
Google Trends can help pinpoint which region, sub-region or city returns the most queries for a target search term. This can help with optimizing regional and hyperlocal content strategies.
Optimizing content strategy to target the best geographies can give publishers an edge over their competitors, as it is likely that several publishers miss out on promising geographies for their content simply because they don’t appear to be the most obvious ones at first glance.
For instance, for our Black Friday example, we can see that besides the US, there is considerable interest from some unexpected places such as South Africa and Romania. Armed with this knowledge, publishers in these places can reorient their content strategies.
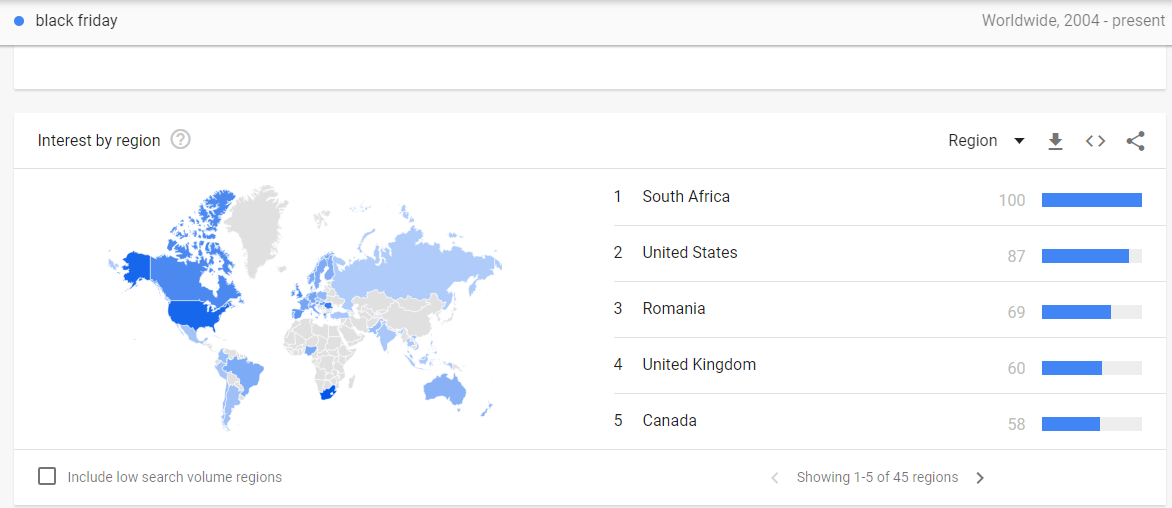
It bears repeating that the figures here do not represent absolute search numbers, but rather the ratio of the search numbers for a specified keyword and the total number of searches in the region.
Google Trends allows users to plot two or more trend lines against each other to measure which of the two is more popular within the given time frame.
For instance, in the US both Thanksgiving and Black Friday are popular holidays targeted by marketers. However, if you have limited resources and want to maximize your traffic to coincide with these holidays, you might need to prioritize one over the other.
Google Trends can help you identify which to prioritize.
Below, we plotted trending searches for both Thanksgiving and Black Friday in New York with a time frame of November 21-27, 2021.
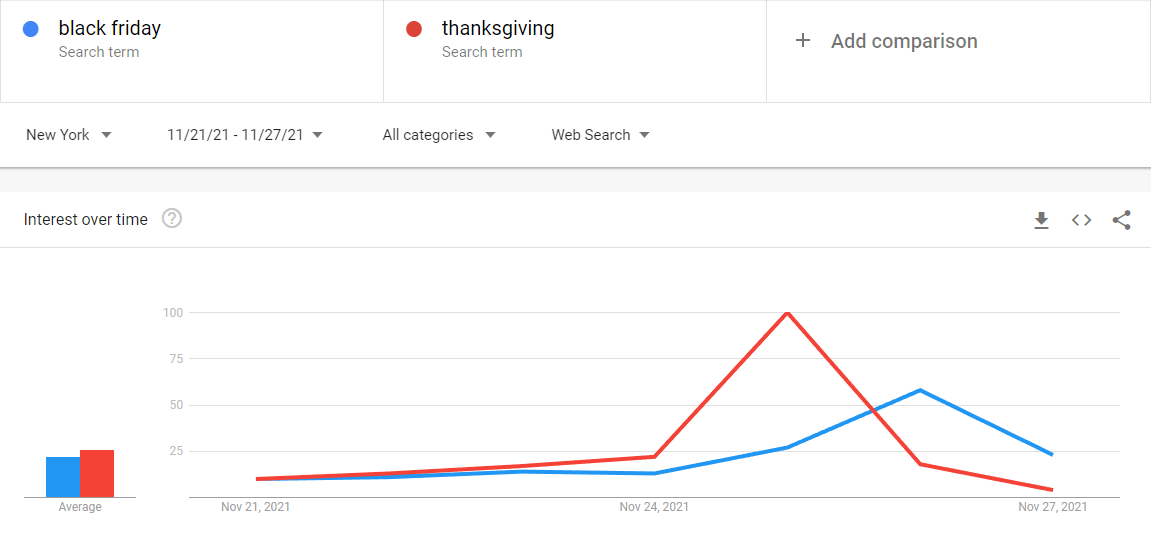
We can see that Thanksgiving is the clear winner with a much higher peak than Black Friday. This means if your resources are limited, you’ll likely achieve better results by prioritizing Thanksgiving.
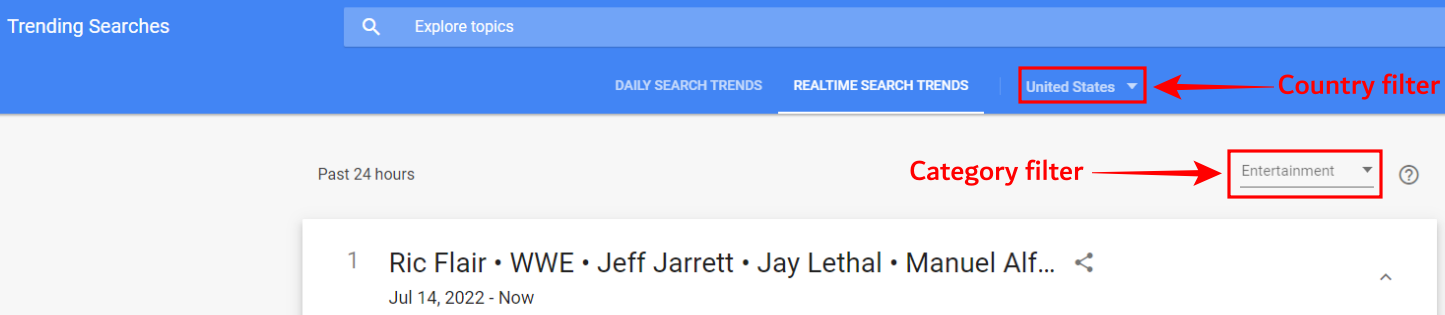
Google Trends allows you to monitor search trends in real time. Simply open the Google Trends search console and select the “Realtime Search Trends” tab from the top menu.
This shows the most trending searches within the last hour with their trendlines over the last 24 hours plotted next to them. These trendlines are handy in determining whether the trend is still ascending or has passed its peak.

Realtime search trends are useful for news publishers interested in content that peaks quickly. Realtime trends can also be filtered by location and category as well.
Clicking on each trending news item takes the user to a new page with even more detail about the trend, including related news and related queries.

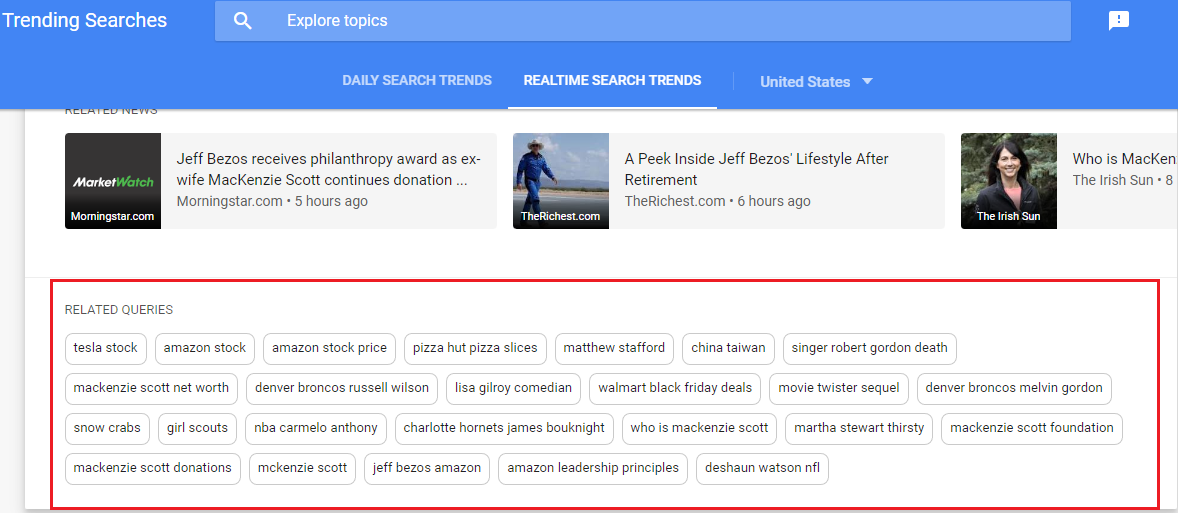
The “Related Topics” and “Related Queries” sections, besides being a source of discovering new niches and keywords related to your primary search term, also display the rates at which searches for each of these related topics and queries have been growing in the specified time frame.
When the popularity of a keyword increases by more than 5000% in the given time frame, Google Trends displays it as a Breakout keyword.
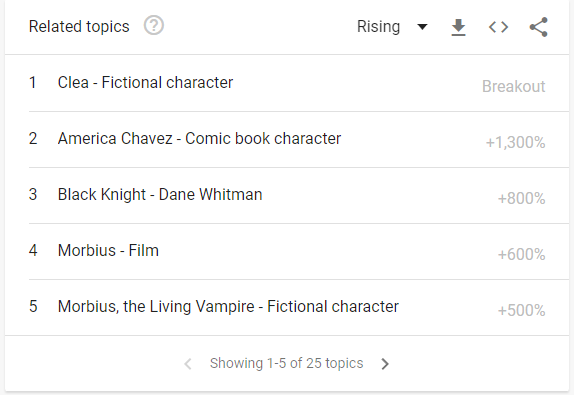
Breakout keywords allow publishers to capitalize on trends right before they are about to hit their peak.
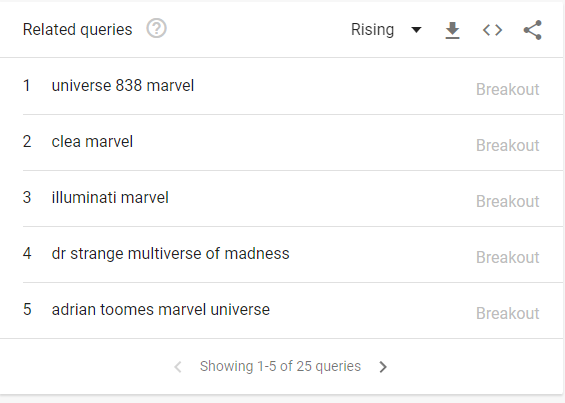
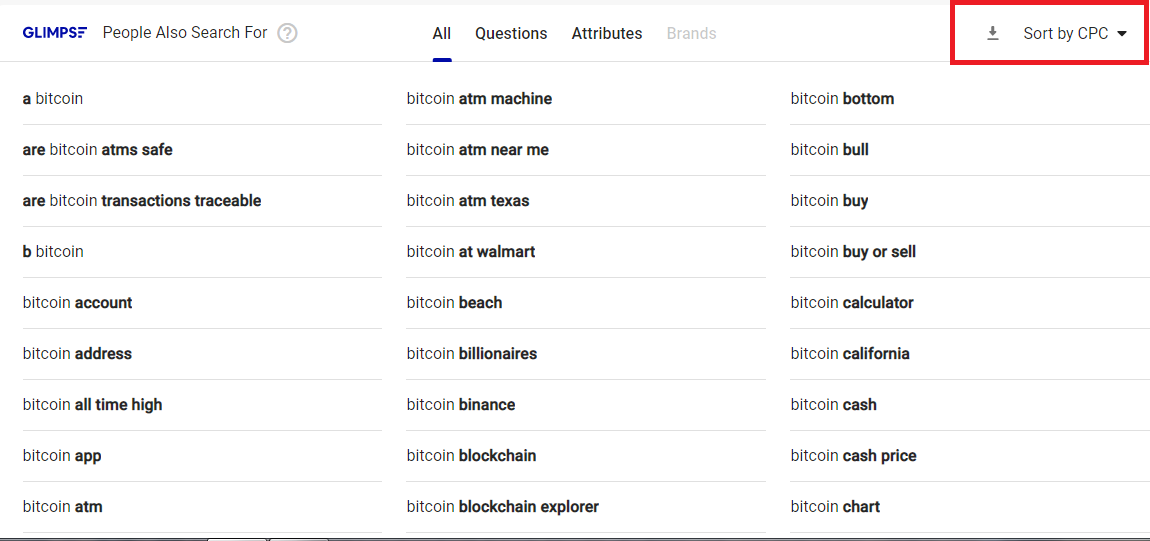
Pro Tip: Use the Glimpse browser extension for Chrome to receive even more detailed data on related queries. Not only does Glimpse show related queries, it also displays questions related to the keyword that users entered into Google. Glimpse even allows related queries to be sorted by CPC.
In the screenshot below, we searched for Bitcoin on Google Trends, and Glimpse filled the Related Queries section with way more options that Google Trends alone would have done, with the option to sort them by CPC.
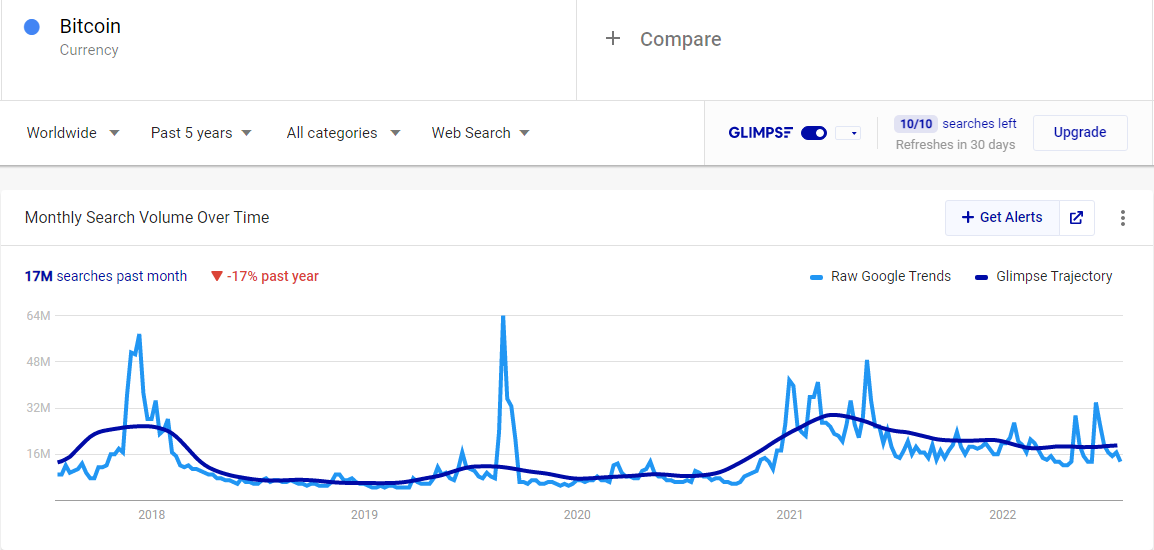
 What’s more, Glimpse even overlays the Google Trends trendline with its own graph showing absolute search volume numbers for the requested keyword, as can be seen in the screenshot below.
So the Y-axis on the Google Trends screen now no longer shows relative popularity measured on a scale of 0-100, but rather, the absolute search number for a selected time period.
Using Google Trends as described above will also allow you to identify how fresh your content is, which is incredibly important for the SEO of certain topics.
To learn more about content freshness and its importance, check out our dedicated module on the subject.
While we’ve covered the essential use cases of Google Trends, this is not the limit of the tools’ usefulness, however.
There are other Google Trends features that publishers can make use of to enhance their content strategy.
Benchmarking involves comparing one or more related keywords against a category term representing the industry average. This allows us to determine which keywords are outpacing the industry average, and hence deserve greater resource allocation.
In the example below we plotted three keywords in the home decor niche — curtain, bedsheet and carpet — against the parent term home decor. 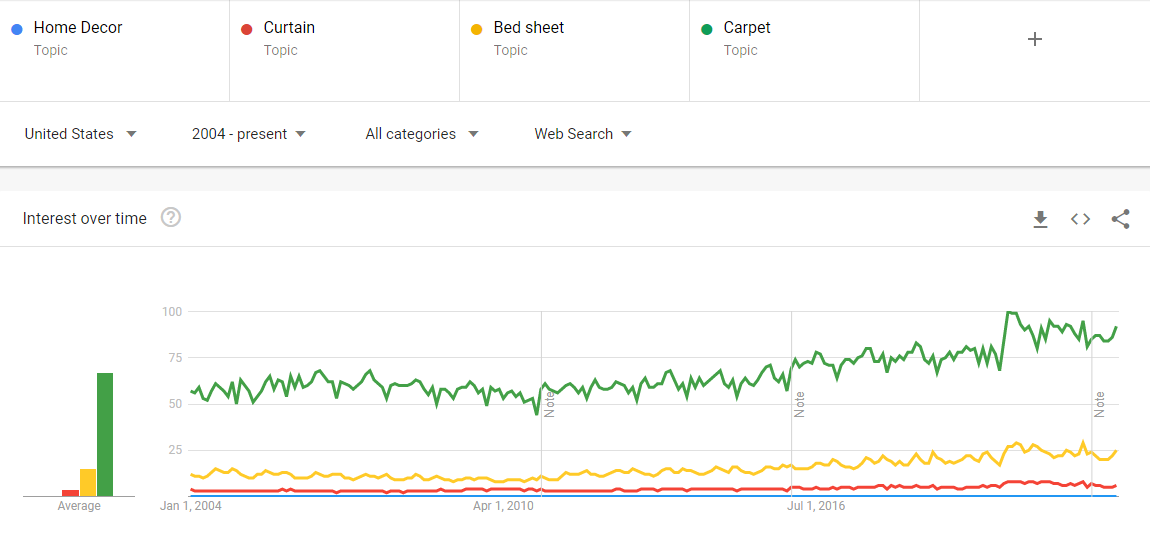
We can see that carpet beats the industry average by a wide margin. This indicates that publishers in the home decor niche would do well to prioritize content around carpets.
Beyond this, Google Trends can be used for benchmarking several other performance metrics such as:
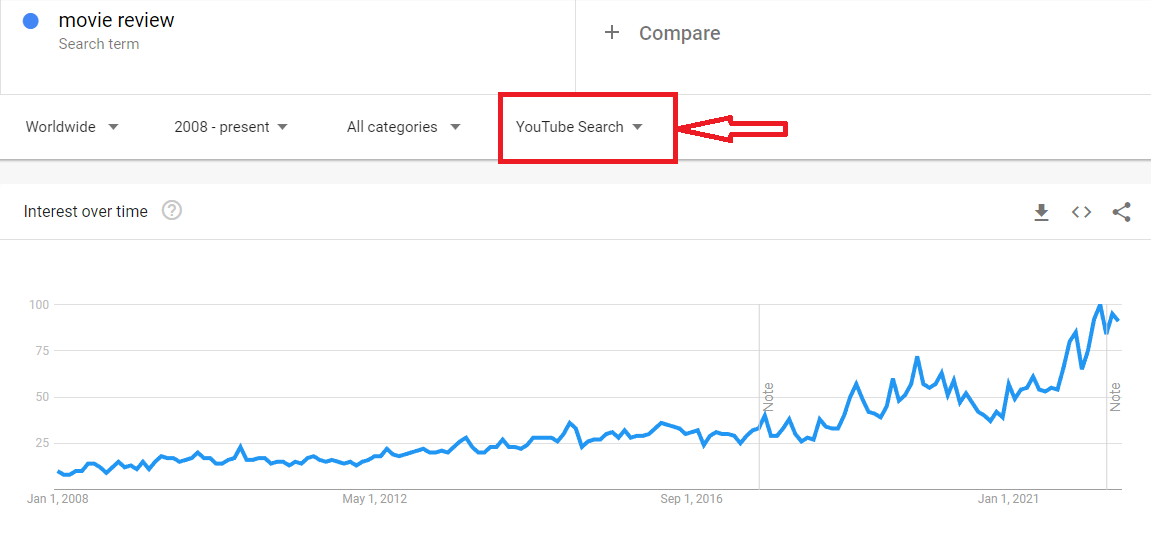
Video content often has completely different dynamics than text. Google Trends doesn’t just give data for web searches, but for YouTube searches as well. This can be done by selecting “Web Search” or “YouTube Search” from the drop-down menu.
For instance, consider the trendline for the search term movie review across YouTube. Clearly, this is a rising trend.
Now consider the trendline for the same search term with “Web Search” selected.
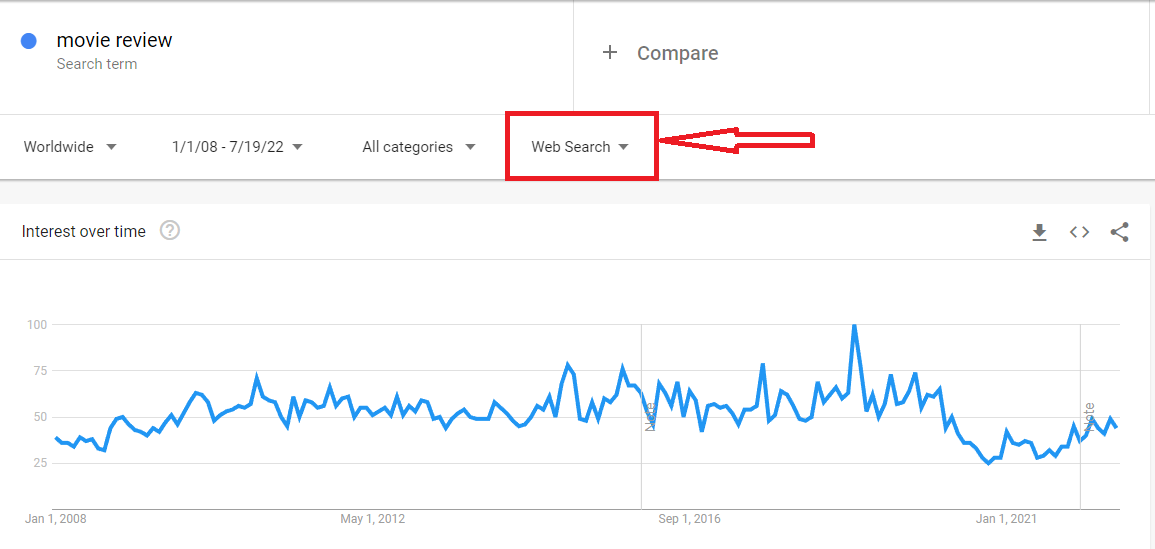
This is a trend that has seen a decline after having stayed largely static for a long time.
What this tells us is that users are now showing a preference for sourcing their movie reviews in video form rather than reading them. This is an example of a paradigm shift in consumer preferences. As a publisher, you need to be aware of such shifts to stay ahead of the curve.
Below is a less obvious example of such a paradigm shift. We entered the keyword gardening for both web search and YouTube search in turn.
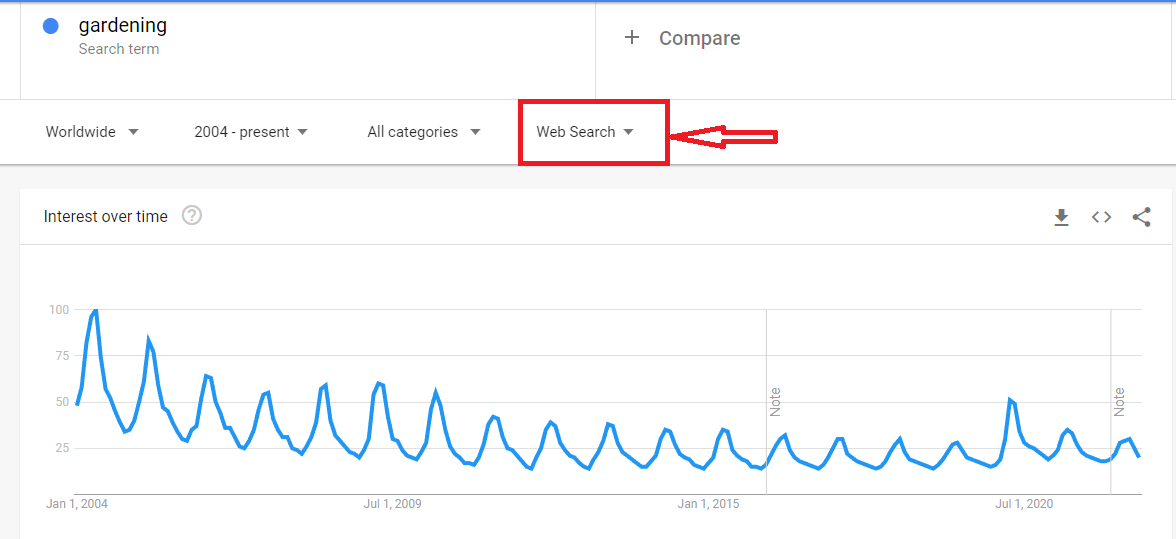
The results were similar to movie reviews.
More people now prefer to watch a video tutorial about gardening than in 2008, while fewer people prefer to read articles and blog posts about gardening than in 2008.
For content marketers with both text and video channels, this knowledge can optimize their content allocation strategy by helping prioritize the appropriate channel for specific types of content.
We now have a good understanding of Google Trends’ potential and how to best harness it. To complete this module, however, we also need to know where the pitfalls are when using Google Trends.
Google Trends lets you analyze search trends under two broad baskets — “Search Term” and “Topic”. These show up as options under the keyword you search for in the search panel, as shown below.
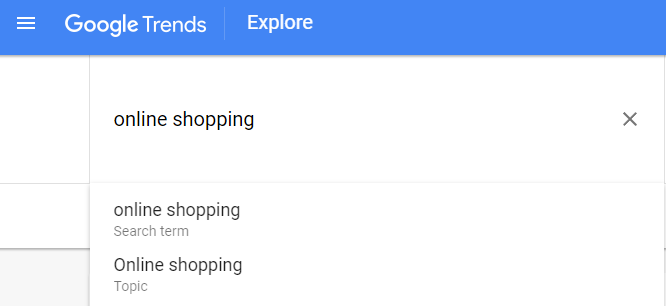
The results you see may vary widely depending on which of the two you select.
This is because “Search Term” will show you results for the exact term you entered. “Topic” on the other hand will show up results for much broader search data that includes spelling variations of the original search term, abbreviations and entities related closely to the original search term.
For instance, in the screenshot below, we can see that the difference between the trendlines for the search term Marvel Comics and the topic Marvel Comics topic are separated by a 15-fold difference.
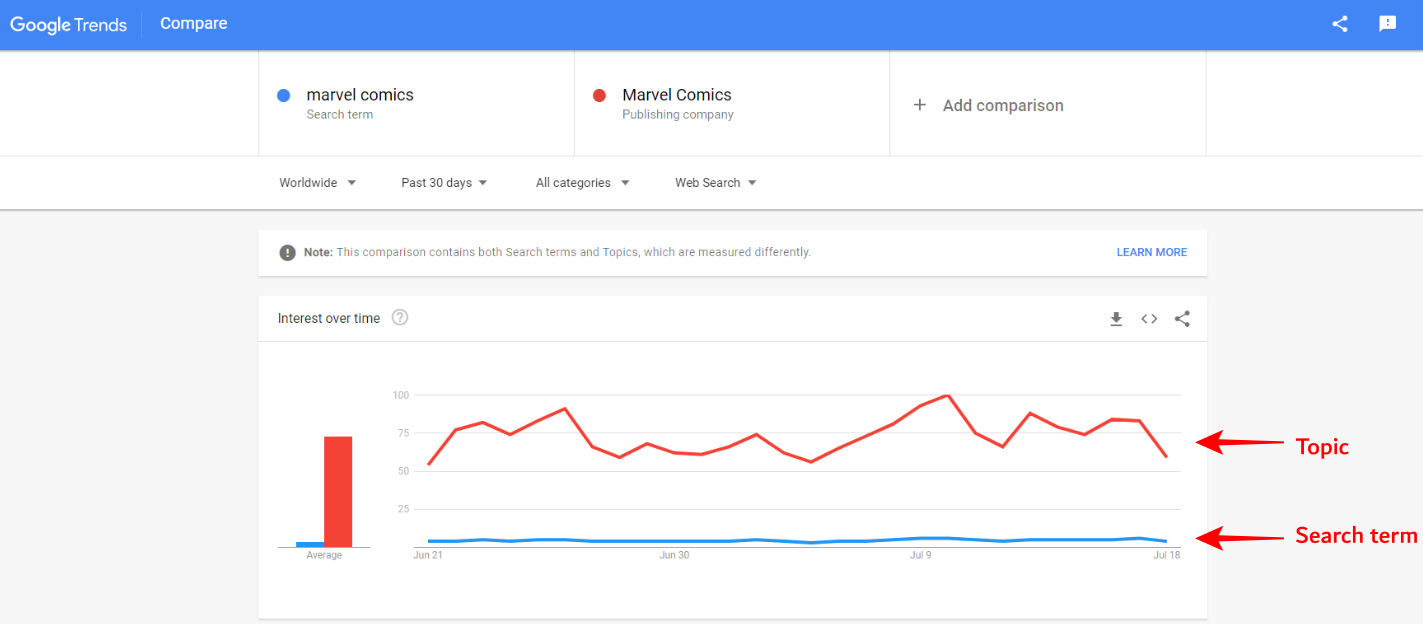
This is because the search term marvel comics gives the trends data for that specific term while the topic Marvel Comics gives trends data for all keywords variations and closely related entities that are connected with Marvel Comics, which could include the various characters from the Marvel universe, its various authors, artists who depicted these characters on screen and so on.
So, if you’re looking for more precise results, it’s better to use Topic over Search Term.
When looking at the “Related Queries” and “Related Topics” sections, you can sort the queries by selecting either “Top” or “Rising” from the drop down menu as shown below.
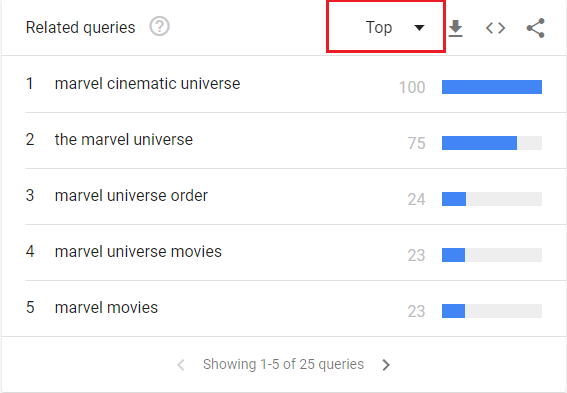
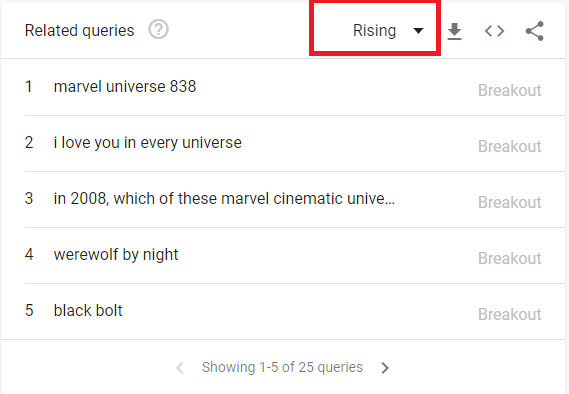
Selecting “Top” displays queries that were being highly searched in the previous time frame as well as in the current time frame, whereas selecting “Rising” only shows trends that are growing in popularity currently.
When looking for real time search trends, Google Trends shows trend graphs next to each search item which indicate whether the trend is rising or is past its peak.
In the screenshot below, we can see that only the second trending news is on the rise. The other two are already well past their peak and declining fast.
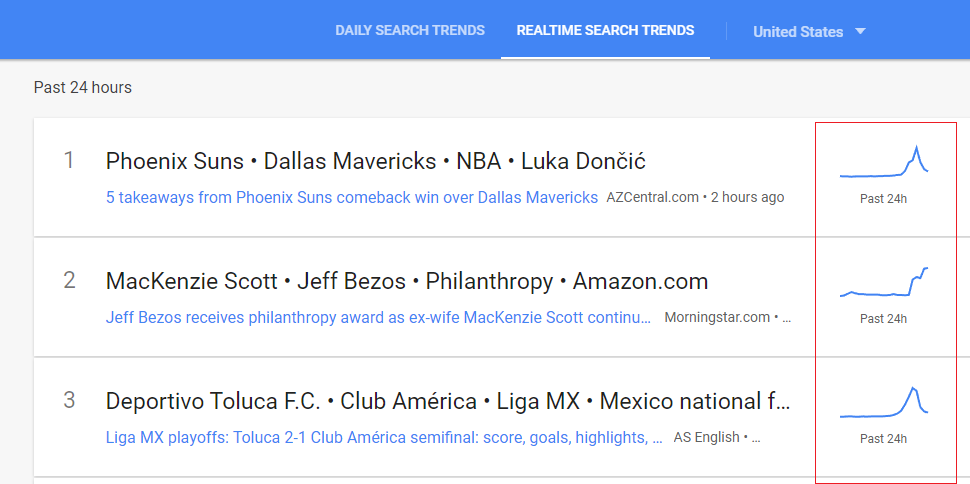
If you’re a news publisher, this gives you important information about which trends to prioritize over others.
Fads are SEO dinosaurs — trends that once ruled the search engines but went extinct a long time ago.
Publishers should avoid investing time and energy in creating content for keywords in which interest is steadily declining.
Looking up “selfie stick” on Ahrefs turns up a long list of juicy keywords with high search volumes and relatively low keyword difficulty. On the face of it, this looks like the perfect long-tail keyword with the potential to generate good traffic.
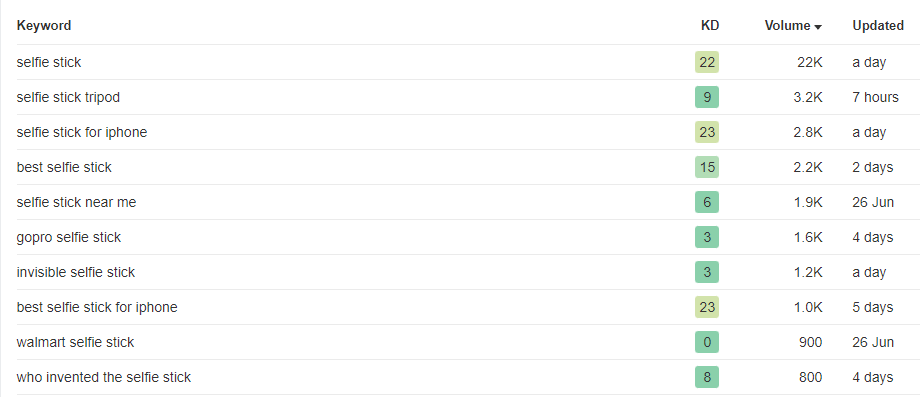
However, a quick look at Google Trends reveals a different picture altogether.
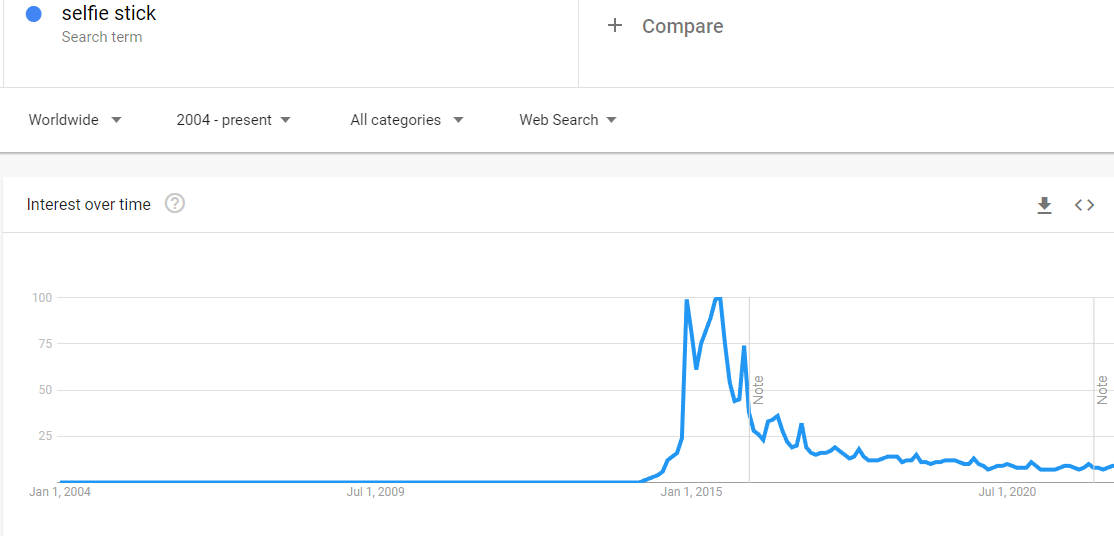
As can be seen, interest in selfie sticks peaked around 2015-2016 and has been steadily declining ever since.
Pro Tip: Toggling between Google Search, Google Trends and a keyword research tool can be a little cumbersome. Trendstastic is a useful Chrome extension that shows the Google Trends trendline right in the Google SERP, making keyword research easier.
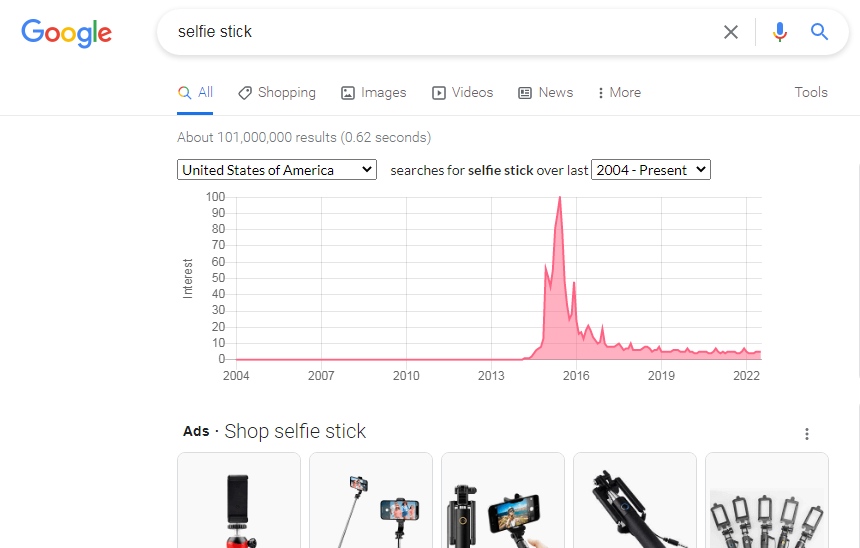 This is a great help in cases where all that is needed is a quick look at the trendline to ascertain whether a keyword is a fad or not.
Google Trends is a great tool for keyword research, spotting trends before they go viral, covering trending news stories in real time and much more.
The best part about Google Trends is that it does all this for free.
However, it is good to remember that Google Trends is a highly sampled tool, and it is best used in conjunction with other keyword research and SEO tools for best results.