WordPress is the most popular content management system (CMS) on the planet, thanks to its ease of use and flexibility. WordPress’ rich customization options allow publishers to create websites that resonate deeply with their audiences.
And yet despite the CMS’s powerful featureset, it’s still possible to create sites that look great but struggle to grow audience numbers. While a content audit is certainly advisable, publishers should first consider a technical audit to ensure there’s nothing going on in their site’s background that is bottlenecking their reach.
Chief among the performance metrics they should be measuring are the Google Core Web Vitals (CWVs).
These metrics, which Google converted into ranking signals shortly after their introduction in 2020, play a key role in measuring a web page’s user experience (UX).
The CWVs encompass three distinct yet connected metrics:
- Largest Contentful Paint (LCP)
- First Input Delay (FID)
- Cumulative Layout Shift (CLS)
These signals measure the perceived load speed, interactivity and visual stability of a web page, respectively.
Let’s take a closer look at these CWVs to understand why they’re so important, how to measure them accurately and then weigh up the actionable steps we can take to boost their scores.
What Are Core Web Vitals Metrics?
Google’s three Core Web Vitals (CWVs) evaluate the quality of a website’s user experience (UX), providing insight into how well web pages perform in terms of loading speed, interactivity and visual stability.
- Largest Contentful Paint (LCP): This measures site loading speed and specifically refers to the point in the loading process when the main content is likely to have loaded.
Take, for example, a blog post about a hot new tech gadget. If the main image — perhaps a picture of the gadget — and the introductory text load rapidly (within 2.5 seconds is Google’s advised threshold for LCP), visitors are more likely to stay, read and engage with the content.
Conversely, slow load times can lead to visitors abandoning the page, which can result in decreased traffic.
- First Input Delay (FID): This represents a snapshot of how responsive a web page is upon first user interaction, such as a link click or button press, by measuring the time between this action and when the browser can start processing event handlers in response.
Consider a “Subscribe Now” button. If a visitor clicks this button and experiences a delay before the site responds (anything over 100 milliseconds is considered a poor result), the visitor might think the site is unresponsive, leading to a poor user experience and potentially a lost subscription.
Google is preparing to introduce a new metric called Interaction to Next Paint (INP) in March 2024 that will replace FID as a CWV.
- Cumulative Layout Shift (CLS): This quantifies visual stability, or the amount of unexpected layout shift of visible content on a web page.
If a news website has text, images or ads that suddenly shift as the page fully loads, visitors may lose their place or accidentally click on an unintended link or button. This is a frustrating experience and may discourage them from returning to the site.
Source: Web.dev - Interaction to Next Paint (INP): This evaluates a page’s overall responsiveness to user interactions. It monitors the latency of all mouse and keyboard interactions throughout a user’s visit to a web page, with the longest interaction observed (ignoring outliers) forming the final INP value.
Achieving an ideal INP score may pose a challenge due to the wide variability in device capability. However, it will still be reasonable for publishers to aim for an INP score in the 75th percentile of page loads, segmented across mobile and desktop devices.
A website with an INP at or below 200 milliseconds is considered to have good responsiveness. If the INP is between 200 milliseconds and 500 milliseconds then the site’s responsiveness needs some work. Lastly, if the INP is greater than 500 milliseconds, its responsiveness is considered poor.
Source: Web.dev
Why Is the Core Web Vitals Score Important?
Users demand swift loading speeds, smooth interactivity and a visually stable environment and a Core Web Vitals assessment is pivotal to helping publishers understand how their websites’ are delivering on this front.
Google found that bounce probability jumped 32% when page load times climbed from 1 second to 3 seconds. Meanwhile, news sites that passed the CWV test saw a 22% lower abandonment rate than those that failed.
1. Influence Search Results
CWVs act as a yardstick for Google to measure the performance of a website. They provide Google with insights into how well a website is serving users, which directly impacts that site’s position in search results.
In simple terms, a better CWV score can help a WordPress website appear higher in Google’s search rankings.
2. Boost Traffic
Sites with optimized CWVs can see an increase in traffic. For example, popular career guidance site LearnHowToBecome.org reduced its average load time from 7 to 2.9 seconds and saw its monthly traffic increase from 500,000 to 750,000.
3. Boost Revenue
A user is less likely to read an article if they experience a long load time (LCP), delayed response to their interaction (FID) or an unstable layout (CLS). Websites that excel in all three metrics not only hold the user’s attention but can also lead them down the conversion funnel, ultimately driving more revenue for the business.
In essence, CWV metrics are more than just numbers. They provide insights into a site’s performance from a user’s perspective, allowing the brand to improve upon areas that matter the most to their visitors.
How to Check a WordPress Site’s Core Web Vitals Scores
Understanding how to check CWV scores is the first step towards improving a website’s performance. There are two ways to measure these scores, either in house using Google’s first party tools or with the help of a WordPress specialist that has experience in optimizing performance metrics.
For those that chose to go the in-house route, it’s important to understand that measuring CWVs requires using a mix of field data and lab data.
Field data is actual user experience data, collected from real-world environments. This kind of data gives a better understanding of how users are engaging with a website across a variety of devices, connections and other real-world conditions.
For instance, if users are primarily accessing a WordPress site on mobile devices on 3G networks, field data can reveal performance issues that might not appear in a controlled lab environment.
On the other hand, lab data is generated in a controlled environment and used to debug performance issues. It doesn’t capture the full spectrum of real-world user experiences but provides reproducible results for debugging and optimizing a website’s performance.
Using a tool such as Lighthouse in a development environment can simulate a slow network to identify performance bottlenecks.
All of Google’s popular developer tools, from Google Search Console (GSC) to Google Analytics (GA) can measure CWV scores.

Source: Web.dev
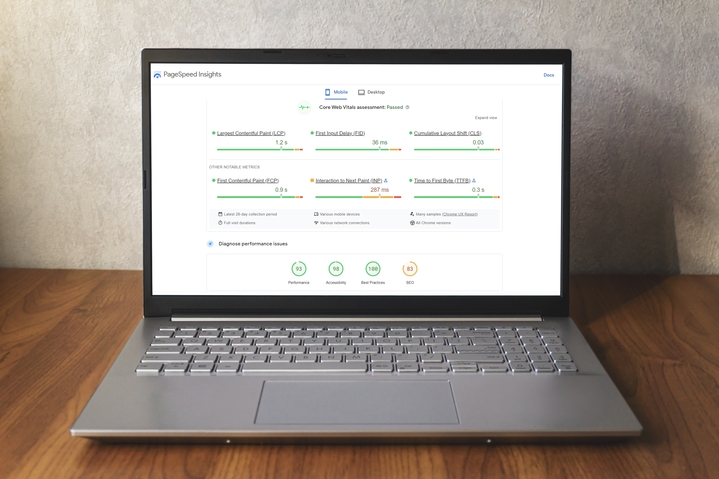
For today, however, we’re going to look at Google’s PageSpeed Insights tool for the simple reason it’s one of the simplest and most comprehensive tools with which to get started.
How to Discover and Improve FID and TBT With PageSpeed Insights
Up until this point we’ve talked about First Input Delay (FID) as a means of measuring a site’s responsiveness, but in this next section we’ll actually be looking at both FID and Total Blocking Time (TBT).
Both are measures of user interactions and measuring and optimizing both can have positive outcomes for a site’s UX.
1. What Is TBT and How Does It Differ From FID
TBT indicates the time span during which a website is too preoccupied to react to user interactions, such as button clicks. TBT measures the total duration that a web page is “blocked” — which is akin to the web page saying: “Hold on, I’m busy” as it processes other tasks.
TBT is a lab metric used for performance evaluation during the development phase, while FID is a field metric that provides insights into actual user experiences.
In a scenario where a user clicks a button on a web page, FID gauges the delay that takes place between that user’s action and the website’s response.
These two metrics are interconnected — if a publisher manages to optimize TBT during testing, they’re likely to observe a positive impact on FID scores in real-world circumstances.
2. How to Measure FID and TBT with PageSpeed Insights
To measure these metrics with PageSpeed Insights, follow these steps:
- Navigate to the PageSpeed Insights tool
- Analyze the desired web page
- Scroll to find the site’s FID and TBT scores

3. How to Improve the FID and TBT of a WordPress Site
Improving FID and TBT involves optimizing a site’s responsiveness and interactivity. Here are some tips:
- Compress and optimize the CSS and JavaScript code: This helps reduce file sizes and improves the responsiveness of the site. Many tools, such as WPRocket, will offer a file optimization tab that offers to compress the code, potentially leading to a significant improvement in FID and TBT scores.
- Eliminate long tasks: Long tasks are those that block the main thread for 50 milliseconds or more. Splitting these long tasks into smaller, asynchronous tasks can free up the main thread and improve both FID and TBT.
- Optimize JavaScript execution: The parsing, compiling and execution of JavaScript can be a major contributor to high FID and TBT. Deferring unused JavaScript, async loading necessary large files, minimizing unused polyfills and ensuring that JavaScript executes efficiently can reduce FID and TBT.
- Leverage WordPress theme’s performance settings: Many WordPress themes come with built-in performance settings. Take full advantage of these settings to optimize the site.
- Asset preloading and postloading: Techniques such as image lazy loading, deferring non-critical CSS, preloading critical assets and prefetching third-party resources can enhance TBT performance and, subsequently, improve FID as well.
Pro Tip: When optimizing, focus on the overall UX rather than individual metric scores. This holistic approach can yield better results in improving site performance.
Improving FID scores is a complex process as it deals with website code. Hence, the first thing publishers should do is limit heavy JavaScript execution and eliminate unnecessary JS files, allowing the browser to quickly respond to user interactions.
By addressing the key issues that affect a WordPress site’s interactivity, publishers can effectively improve both FID and TBT, enhancing overall UX and performance.
How to Discover and Improve LCP with PageSpeed Insights
Poor LCP scores mean a visitor has to wait longer for the content to appear, which typically leads to higher bounce rates.
1. What Are LCP Elements?
LCP assesses the time it takes for the main content of a web page to load: the quicker this content appears on a screen, the better the UX.
The main contributors to the LCP score are predominantly sizable elements, such as image elements, video elements or elements with background images loaded through URL functions.
Additionally, block-level elements — such as headings, subheadings and tables, and block-based elements such as text — also play a vital role in shaping the LCP.
2. How to Measure LCP with PageSpeed Insights
In order to measure the LCP score, follow these steps:
- Navigate to PageSpeed Insights
- Analyze the desired web page
- Scroll to the “Diagnose performance issues” section
- Set the “Show audits relevant to” to LCP
- Users can now view the relevant Opportunities and Diagnostics.
Publishers can also identify the LCP element in the PageSpeed Insights report by locating the Largest Contentful Paint element recommendation in the Diagnostics section and expanding it for further details.

3. How to Improve the LCP of a WordPress Site
Improving LCP involves several steps, each contributing to a faster, more streamlined website experience. Here are some key strategies:
- Optimize the LCP element: This step depends on the nature of the LCP element. For example, an LCP element that is a picture can be compressed (without compromising quality). Other solutions include preloading above-the-fold and placeholder images, serving responsive images using srcset depending on the user screen size and making sure to not lazyload above-the-fold images.
- Improve server response times: LCP measures the time from a user arriving on a page to the point their browser receives a response from the server. Investing in a higher-quality web hosting plan, implementing a proper caching mechanism at both the server level and the browser level and moving to a robust CMS platform such as WordPress can help decrease server response time.
- Reduce render-blocking elements: Render-blocking elements such as HTML, fonts and CSS are static files that the browser processes first before it loads the content. Fewer render-blocking sources means browsers will spend less time rendering these elements, speeding up loading times and improving LCP scores. For instance, publishers can use a simple font for their web pages or preload modular web fonts.
- Remove unused plugins: WordPress sites can use plugins to manage many of their technical aspects. However, it’s important to only keep the plugins and their features that directly contribute to a site’s functionality, while removing unused ones. This can declutter the site and improve the LCP score.
Pro Tip: Caching is a powerful process that can significantly improve the LCP score. Implement a caching solution that saves a static copy of web pages on visitors’ devices, eliminating the need to download the same data every time they visit the site.
It’s important to understand that LCP is by far the most challenging CWV metric to improve. This is because LCP depends on TTFB (Time to First Byte), which relies on how fast the server responds. Depending on the framework used, it can be challenging to reduce the server response time.
Publishers need to bear in mind that the margin of improvement can vary based on the infrastructure they’re working with.
By focusing on optimizing the main page content elements, improving server response times, reducing JavaScript and CSS blocking times and being judicious about plugin usage, publishers can significantly improve their LCP scores.
How to Discover and Improve CLS With PageSpeed Insights
Cumulative Layout Shift (CLS) revolves around visual stability, gauging any unexpected shifts in a web page’s visual content as it loads. Visually unstable web pages can erode their UX, contributing to bounce rates.
1. What are CLS Elements?
CLS measures visual stability, so the elements that contribute to it are those that could potentially change positions unexpectedly while the page loads. These could be images without specified dimensions, ads, embeds and iframes without fixed dimensions.
Essentially, any element that can move around while the page is loading can hurt the CLS score.
2. How to Measure CLS With PageSpeed Insights
Use PageSpeed Insights to identify and measure a web page’s CLS with these steps:
- Navigate to PageSpeed Insights
- Analyze the desired web page
- Scroll to the “Diagnose performance issues” section
- Set the “Show audits relevant to” to CLS

This approach allows us to zero-in on the elements responsible for layout shifts, providing a starting point for improvement.
3. How to Improve the CLS of a WordPress Site
Improving the CLS of a WordPress site involves strategic steps that can significantly enhance a page’s visual stability:
- Edit the element layout: Review and adjust the layout of elements to ensure they don’t shift during page loading. This step will involve setting specific width and height attributes for images and videos, and statically reserve space for lazy-loaded ads or iframes by using a placeholder.
- Use Critical CSS or remove unused CSS: Unused CSS can contribute to layout shifts. Consider implementing Critical CSS that contains only the styles used above the fold or eliminate redundant CSS codes to prevent unnecessary shifts. Inlining smaller styles and preloading important styles will also help to improve CLS.
- Avoid Sliders plugins: Sliders can trigger layout shifts due to their dynamic nature. If possible, steer clear of them.
- Apply correct image and div sizing: Accurate sizing and using responsive images of the same aspect ratio can prevent elements from shifting as the page loads. Always specify the sizes of these elements in the image CDN (content delivery network).
- Move CSS from theme editor to child theme style.css: Transferring CSS to a child theme can help reduce layout shifts by ensuring styles load correctly.
- Use themes and plugins that use transform animations: These tools have less impact on layout shifts compared to other types of animations.
By making these adjustments, WordPress site owners can considerably reduce their page’s CLS score, leading to a more stable and enjoyable UX.
Pro Tip: Implement lazy loading for offscreen images. This strategy allows images to load only when they’re about to enter the viewport, thus preventing layout shifts caused by late-loading images.
Keep in mind that the CLS is a critical user-centric metric that measures the extent to which a site’s content has shifted as the page loads. The lower the CLS score, the better the user experience.
Ultimately, improving CLS scores requires a multi-pronged approach. Regular checks with tools such as PageSpeed Insights, consistent layout practices and diligent use of themes and plugins can all contribute to a lower CLS score and a more stable, user-friendly website.
Wrapping Up
Publishers that measure Core Web Vitals (CWVs) will be better placed to optimize their sites user experience.
Not only will optimizing CWVs help significantly enhance reader experience, but doing so also contributes to SEO. Pages that load quickly, are visually stable and respond quickly to user inputs are not just attractive to users but also search engine algorithms.
Apart from learning the ropes of tools like PageSpeed Insights, publishers should also closely monitor digital publishing trends, search engine algorithm updates and expert insights to consistently deliver a world-class reading experience.


